Fosamax
Product Images NDC 54868-4463

View Photos of Packaging, Regulatory Labels, and Product Appearance

Product Visual Gallery

This gallery contains 11 technical images submitted to the FDA as part of the official labeling for Fosamax (NDC 54868-4463). Unlike standard consumer photos, these assets often include clinical data figures, molecular chemical structures, and official manufacturer packaging layouts.

As provided by Physicians Total Care, Inc., these visuals offer a comprehensive scientific overview of the product's physical and chemical identity, aiding pharmacists and researchers in product verification and study.

FDA Label Image

Image Of 10 mg Package Label (10mg Package Label)
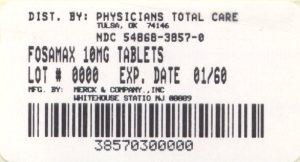
Image Of 10 mg Package Label (10mg Package Label)
Label for Fosamax 10 mg tablets distributed by Physicians Total Care, Inc. The label includes lot number 000 and expiration date 01/60. It is manufactured by Merck & Company, Inc., Whitehouse Station, NJ. The label also features a barcode and the NDC number 54868-3857-0.*
FDA Label Image

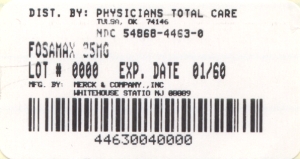
Image Of 35 mg Package Label (35mg Package Label)

Image Of 35 mg Package Label (35mg Package Label)
A small white rectangular label showing distribution information for Fosamax 35 mg by Physicians Total Care, Inc. It includes the National Drug Code (NDC) number 54868-4453-0, a lot number (0000), and an expiration date (01/60). The label indicates that the product is manufactured by Merck & Company, Inc., located in Whitehouse Station, New Jersey. A barcode is printed at the bottom with the numeric code 44630040000.*
FDA Label Image

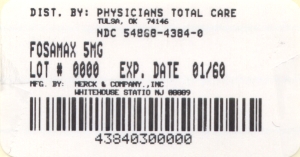
Image Of 5 mg Package Label (5mg Package Label)

Image Of 5 mg Package Label (5mg Package Label)
Label for Fosamax 5 mg tablets distributed by Physicians Total Care, Inc., Tulsa, OK. The label includes lot number 0000, expiration date 01/60, and a barcode. Manufactured by Merck & Company, Inc., Whitehouse Station, NJ.*
FDA Label Image

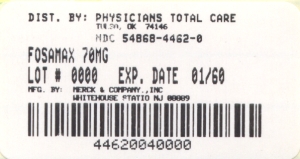
Image Of 70 mg Package Label (70mg Package Label)

Image Of 70 mg Package Label (70mg Package Label)
Label for Fosamax 70 mg distributed by Physicians Total Care, Inc., showing lot number 000 and expiration date 01/60. The manufacturer is Merck & Company, Inc., Whitehouse Station, NJ. The label includes a barcode and NDC 54868-4462-0.*
FDA Label Image

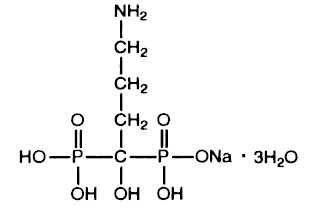
Image Of Chemical Structure (Chemical Structure)

Image Of Chemical Structure (Chemical Structure)
Chemical structure of alendronate, showing its molecular arrangement with phosphate groups and sodium ion, labeled with water molecules (3H2O). This structure corresponds to the active ingredient in Fosamax by Physicians Total Care, Inc.*
FDA Label Image

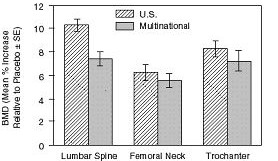
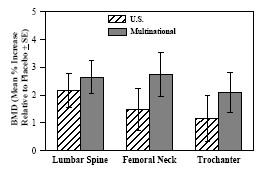
Image Of Figure 1(osteoporosis Treatment Studies In Postmenopausal Women) (Figure 1)

Image Of Figure 1(osteoporosis Treatment Studies In Postmenopausal Women) (Figure 1)
A bar chart comparing the mean percentage increase in bone mineral density (BMD) at three anatomical sites: lumbar spine, femoral neck, and trochanter. The chart presents data for two groups, U.S. and multinational, with error bars indicating standard error.*
FDA Label Image

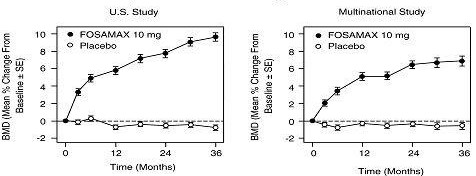
Image Of Figure 2(osteoporosis Treatment Studies In Postmenopausal Women) (Figure 2)

Image Of Figure 2(osteoporosis Treatment Studies In Postmenopausal Women) (Figure 2)
Two line charts comparing bone mineral density (BMD) mean percentage change from baseline over 36 months in a U.S. study and a multinational study. Both charts show Fosamax 10 mg treatment with increasing BMD over time versus placebo with little to no change.*
FDA Label Image

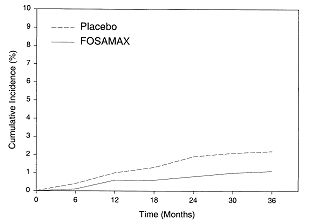
Image Of Figure 3 (cumulative Incidence Of Hip Fractures) (Figure 3)

Image Of Figure 3 (cumulative Incidence Of Hip Fractures) (Figure 3)
A line graph comparing the cumulative incidence percentage over time (in months) between Placebo and Fosamax. The x-axis represents time from 0 to 36 months, and the y-axis shows cumulative incidence from 0 to 10%. The graph shows two lines, with the Fosamax group having a lower cumulative incidence than the Placebo group throughout the period.*
FDA Label Image

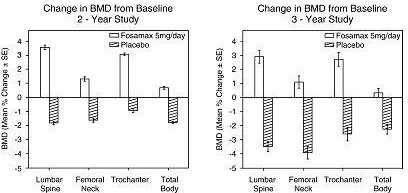
Image Of Figure 4 (osteoporosis Prevention Studies) (Figure 4)

Image Of Figure 4 (osteoporosis Prevention Studies) (Figure 4)
Two bar graphs comparing mean percentage change in bone mineral density (BMD) from baseline for Fosamax 5mg/day versus placebo over 2-year and 3-year study periods. BMD changes are shown for lumbar spine, femoral neck, trochanter, and total body, with error bars representing standard error for each group.*
FDA Label Image

Image Of Figure 5 (studies In Glucocorticoid-treated Patients) (Figure 5)

Image Of Figure 5 (studies In Glucocorticoid-treated Patients) (Figure 5)
A bar chart comparing bone mineral density (BMD) mean percent increases relative to baseline at lumbar spine, femoral neck, and trochanter sites for U.S. and multinational groups. The chart shows mean values with standard error bars for each site between the two groups.*
FDA Label Image

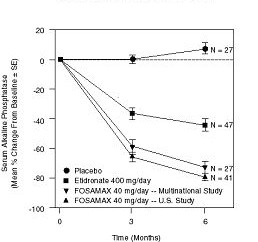
Image Of Figure 6 (studies In Paget's Disease Of Bone) (Figure 6)

Image Of Figure 6 (studies In Paget's Disease Of Bone) (Figure 6)
A line graph comparing serum alkaline phosphatase mean percentage changes from baseline over 6 months in different groups, including placebo, alendronate 400 mg/day, and FOSAMAX 40 mg/day from multinational and U.S. studies. The y-axis shows mean percent change, and the x-axis shows time in months up to 6.*

* About these descriptions: Image descriptions on this page are generated by automated AI analysis of the product label images from the manufacturer's FDA label submission (SPL). They are provided for reference only and may contain errors or omissions. Always rely on the printed label itself and the official FDA labeling, and consult a pharmacist or healthcare professional with any questions about this product.