Androgel
Product Images NDC 54868-4810

View Photos of Packaging, Regulatory Labels, and Product Appearance

Product Visual Gallery

This gallery contains 7 technical images submitted to the FDA as part of the official labeling for Androgel (NDC 54868-4810). Unlike standard consumer photos, these assets often include clinical data figures, molecular chemical structures, and official manufacturer packaging layouts.

As provided by Physicians Total Care, Inc., these visuals offer a comprehensive scientific overview of the product's physical and chemical identity, aiding pharmacists and researchers in product verification and study.

FDA Label Image

Androgel 1% 2.5 G 30 Ct (4792)
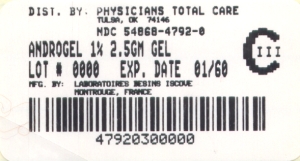
Androgel 1% 2.5 G 30 Ct (4792)
Label for Androgel 1% 2.5 gram gel, distributed by Physicians Total Care, Inc. Includes lot number, expiration date (01/60), and a barcode. Manufactured by Laboratoires Besins Iscove in Montlucon, France. Contains NDC 54868-4792-0.*
FDA Label Image

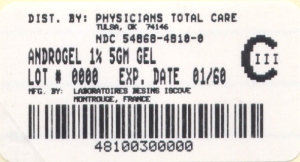
Androgel 1% 5g 30ct (4810)

Androgel 1% 5g 30ct (4810)
Label for Androgel 1% 5GM gel distributed by Physicians Total Care, Inc., Tulsa, OK. The label includes the NDC 54068-4810-0, lot number 000, and an expiration date of 01/60. It also lists the manufacturer as Laboratoires Besins Isocove, Montrouge, France, and features a barcode.*
FDA Label Image

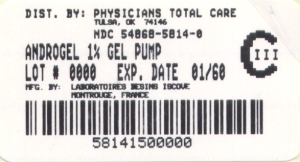
Androgel 1% 2 Multi-dose Pumps Despensing 75g Or 60 Metered 1.25 G Doses (5814)

Androgel 1% 2 Multi-dose Pumps Despensing 75g Or 60 Metered 1.25 G Doses (5814)
Label for Androgel 1% gel pump by Physicians Total Care, Inc. Shows NDC 54068-5814-0, lot number 0000, and expiration date 01/60. Includes distribution details and barcode.*
FDA Label Image

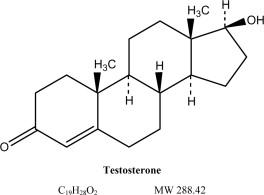
Structural Formula (And01 0009 01)

Structural Formula (And01 0009 01)
Chemical structure diagram of Testosterone, showing the molecular formula C19H28O2 and molecular weight 288.42.*
FDA Label Image

Figure 1 (And01 0009 02)

Figure 1 (And01 0009 02)
A line graph showing testosterone concentration over 24 hours after application for two Androgel doses, 5 g and 10 g. The graph includes plotted testosterone concentration levels with variability bars, and reference lines indicating high and low normal testosterone concentrations.*
FDA Label Image

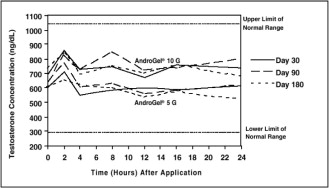
Figure 2 (And01 0009 03)

Figure 2 (And01 0009 03)
A line graph showing testosterone concentration (ng/dL) over time (hours) after application for Androgel 5 G and Androgel 10 G. The graph compares Day 30, Day 90, and Day 180 concentrations with upper and lower limits of the normal range marked.*
FDA Label Image

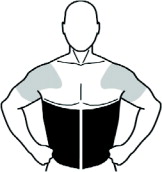
Figure (And01 0009 04)

Figure (And01 0009 04)
An anatomical illustration showing the upper torso and arms of a person with marked grey regions on the shoulders and upper arms and a solid black area covering the chest and abdomen, indicating application sites. This diagram is associated with Androgel, demonstrating its topical application areas.*

* About these descriptions: Image descriptions on this page are generated by automated AI analysis of the product label images from the manufacturer's FDA label submission (SPL). They are provided for reference only and may contain errors or omissions. Always rely on the printed label itself and the official FDA labeling, and consult a pharmacist or healthcare professional with any questions about this product.