Estradiol
Product Images NDC 54868-4811

11 FDA label images from Physicians Total Care, Inc. · Packaging, Regulatory Labels, and Product Appearance

Product Visual Gallery

This gallery contains 11 technical images submitted to the FDA as part of the official labeling for Estradiol (NDC 54868-4811). Unlike standard consumer photos, these assets often include clinical data figures, molecular chemical structures, and official manufacturer packaging layouts.

As provided by Physicians Total Care, Inc., these visuals offer a comprehensive scientific overview of the product's physical and chemical identity, aiding pharmacists and researchers in product verification and study.

FDA Label Image

Image Of Estradiol Sticky Side Of Patch Being Applied To Body (Apply Sticky Side Of Estradiol Patch To Body)
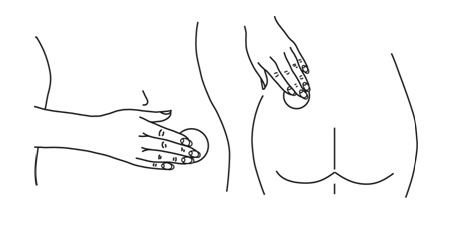
Image Of Estradiol Sticky Side Of Patch Being Applied To Body (Apply Sticky Side Of Estradiol Patch To Body)
An instructional illustration depicting hand application of a topical product to the skin. The image shows one hand applying the product on the abdomen in the left part and the other hand applying it to the upper back or shoulder area in the right part. No additional text or labels are visible.*
FDA Label Image

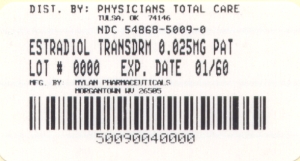
Image Of Estradiol 0.025 mg Package Label (Estradiol 0.025 mg Package Label)

Image Of Estradiol 0.025 mg Package Label (Estradiol 0.025 mg Package Label)
Packaging label for Estradiol Transdrm 0.025MG PAT patches distributed by Physicians Total Care, Inc. The label includes a lot number and an expiration date of 01/60, along with a barcode and the NDC number 54868-5009-0.*
FDA Label Image

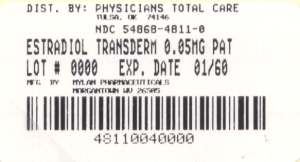
Image Of Estradiol 0.05 mg Package Label (Estradiol 0.05 mg Package Label)

Image Of Estradiol 0.05 mg Package Label (Estradiol 0.05 mg Package Label)
Packaging label for Estradiol Transdermal 0.05 mg patch distributed by Physicians Total Care, Inc. The label shows the lot number, expiration date, and a barcode. The manufacturer is listed as Mylan Pharmaceuticals Inc.*
FDA Label Image

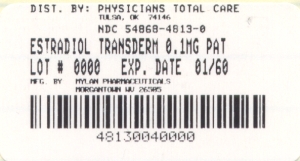
Image Of Estradiol 0.1 mg Package Label (Estradiol 0.1 mg Package Label)

Image Of Estradiol 0.1 mg Package Label (Estradiol 0.1 mg Package Label)
Packaging label for Estradiol Transdermal 0.1 mg patch distributed by Physicians Total Care, Inc. The label includes lot number 0000, expiration date 01/60, and a barcode. Manufacturer information is partially visible.*
FDA Label Image

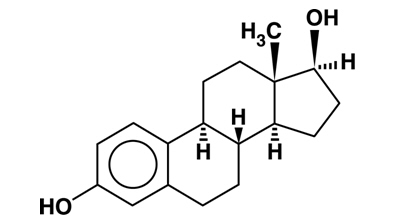
Image Of Estradiol Chemical Structure (Estradiol Chemical Structure)

Image Of Estradiol Chemical Structure (Estradiol Chemical Structure)
Chemical structure of estradiol, depicting its steroid backbone with hydroxyl functional groups. This diagram shows the molecular configuration relevant to the active ingredient estradiol as labeled by Physicians Total Care, Inc.*
FDA Label Image

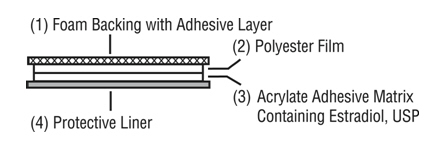
Image Of The Four Layers On Estradiol Patch (Estradiol Comprises Four Layers)

Image Of The Four Layers On Estradiol Patch (Estradiol Comprises Four Layers)
An instructional diagram illustrating the layers of a transdermal estradiol patch. It labels four components: foam backing with adhesive layer, polyester film, acrylate adhesive matrix containing estradiol USP, and protective liner, showing their arrangement in a cross-sectional view.*
FDA Label Image

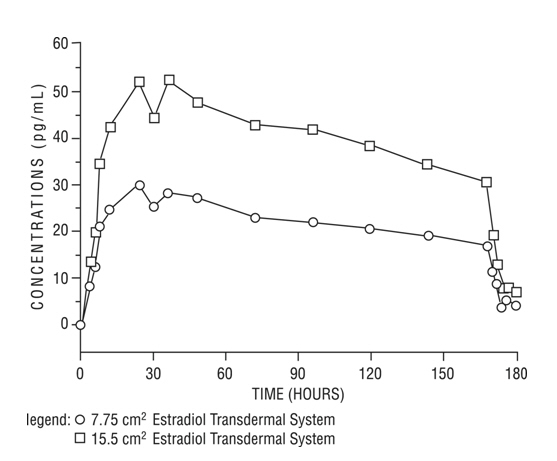
Image Of Figure 1 Mean Serum Graph (Figure 1 Mean Serum Graph)

Image Of Figure 1 Mean Serum Graph (Figure 1 Mean Serum Graph)
A pharmacokinetic curve showing estradiol concentrations (pg/mL) over time (hours) for two transdermal systems. The graph compares 7.75 cm² and 15.5 cm² estradiol transdermal systems, depicting how concentration changes over approximately 180 hours.*
FDA Label Image

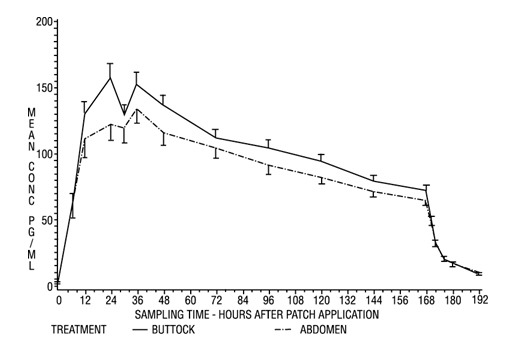
Image Of Figure 2 Observed Mean Graph (Figure 2 Observed Mean Graph)

Image Of Figure 2 Observed Mean Graph (Figure 2 Observed Mean Graph)
A line graph depicting mean concentration (pg/mL) over time (hours) after patch application. It compares two treatment sites, buttock (solid line) and abdomen (dashed line), showing concentration changes from 0 to about 190 hours post-application with error bars indicating variability at each time point.*
FDA Label Image

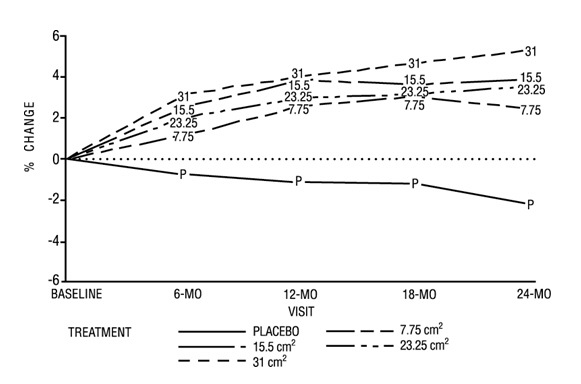
Image Of Figure 3 Mean Percent Graph (Figure 3 Mean Percent Graph)

Image Of Figure 3 Mean Percent Graph (Figure 3 Mean Percent Graph)
Line graph showing percent change over time with visits at baseline, 6, 12, 18, and 24 months on the x-axis and percent change on the y-axis. Multiple treatment groups are compared: placebo, 7.75 cm², 15.5 cm², 23.25 cm², and 31 cm², with plotted lines indicating their respective trends in percent change across the visits.*
FDA Label Image

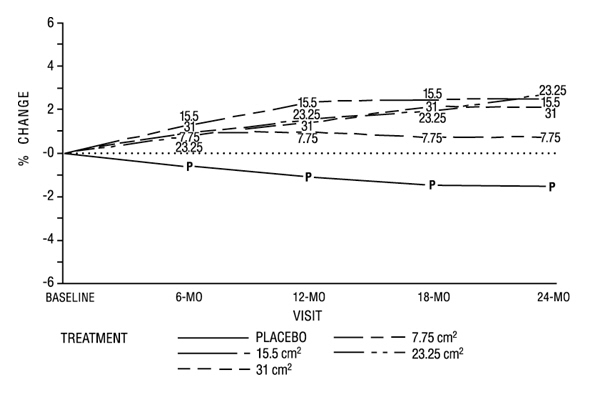
Image Of Figure 4 Mean Percent Graph (Figure 4 Mean Percent Graph)

Image Of Figure 4 Mean Percent Graph (Figure 4 Mean Percent Graph)
A line graph showing percent change over time (baseline to 24 months) for different treatments. The x-axis represents visit months (baseline, 6, 12, 18, 24 months) and the y-axis shows percent change. Four treatment groups are shown: Placebo, and areas 7.75 cm², 15.5 cm², 23.25 cm², and 31 cm², each with distinct line styles. The graph compares how percent change varies by treatment size over the study period.*
FDA Label Image

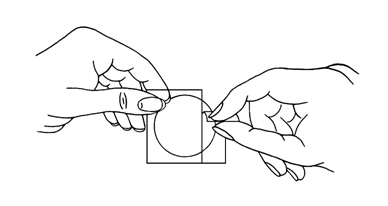
Image Of Estradiol Patch Being Torn From Top To Bottom (Tearing Estradiol Patch From Top)

Image Of Estradiol Patch Being Torn From Top To Bottom (Tearing Estradiol Patch From Top)
An instructional line drawing showing two hands with one peeling or lifting a small circular patch from a square backing, likely demonstrating how to remove a transdermal patch from its protective packaging.*

* About these descriptions: Image descriptions on this page are generated by automated AI analysis of the product label images from the manufacturer's FDA label submission (SPL). They are provided for reference only and may contain errors or omissions. Always rely on the printed label itself and the official FDA labeling, and consult a pharmacist or healthcare professional with any questions about this product.