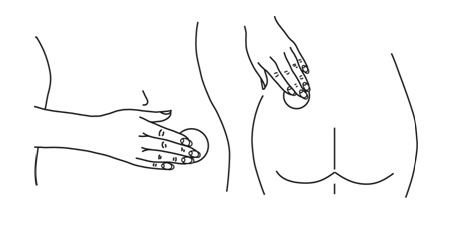
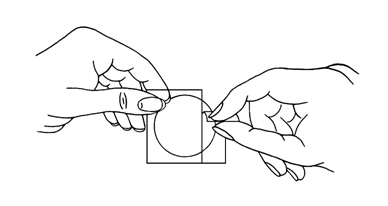
Estradiol
Product Images NDC 54868-4813
View Photos of Packaging, Regulatory Labels, and Product Appearance
Product Visual Gallery
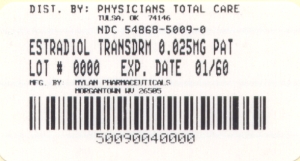
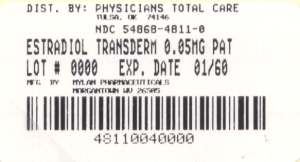
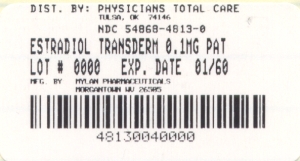
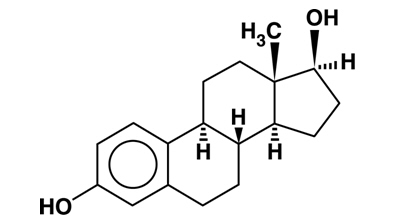
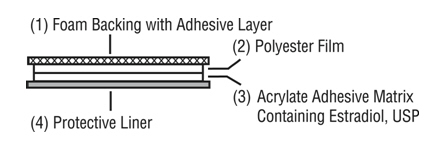
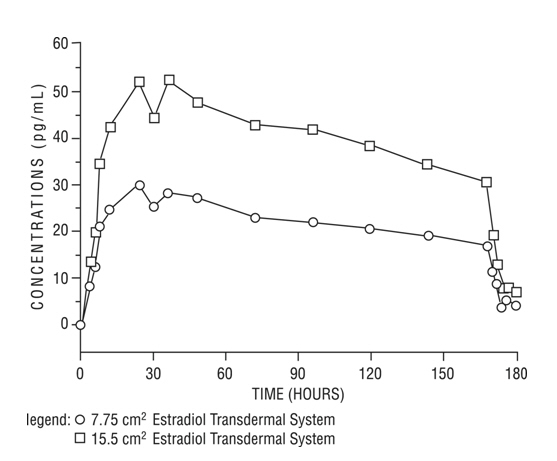
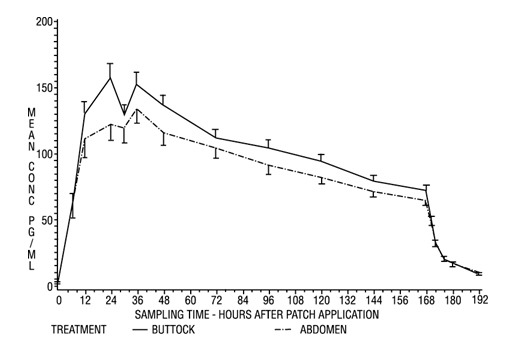
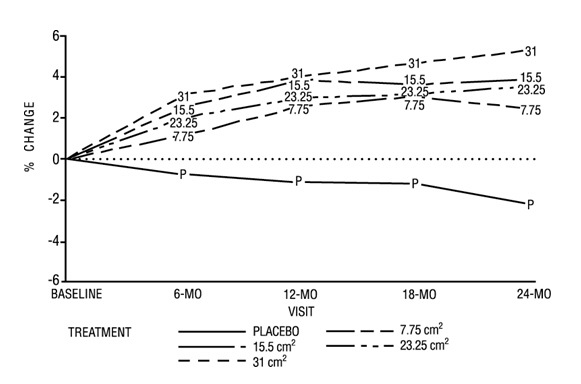
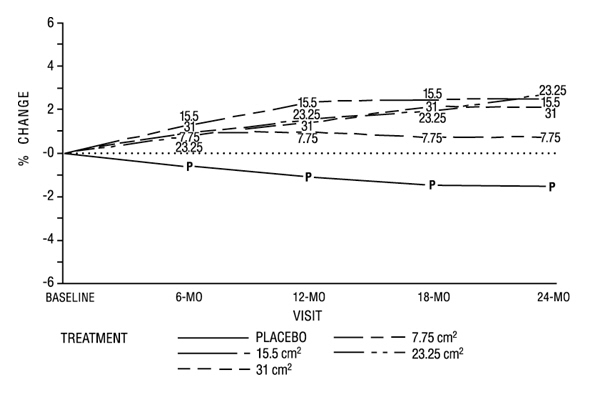
This gallery contains 11 technical images submitted to the FDA as part of the official labeling for Estradiol (NDC 54868-4813). Unlike standard consumer photos, these assets often include clinical data figures, molecular chemical structures, and official manufacturer packaging layouts.
As provided by Physicians Total Care, Inc., these visuals offer a comprehensive scientific overview of the product's physical and chemical identity, aiding pharmacists and researchers in product verification and study.
Product Images & Figures Index
Image Of Estradiol 0.025 mg Package Label (Estradiol 0.025 mg Package Label)
This is a label for ESTRADIOL TRANSDERMAL PATCH, with a concentration of .625mg. The label indicates that it is distributed by PHYSICIANS TOTAL CARE and the product has a National Drug Code (NDC) of 54868-5009-0. The LOT is marked as ¥0000 with an expiration date of 01/60. There is an additional alphanumeric code at the bottom of the label which is not clear.*
Image Of Estradiol 0.05 mg Package Label (Estradiol 0.05 mg Package Label)
This is a product information label for Estradiol Transderm, a medication that comes in a patch form and contains 6.05 micrograms of the hormone estradiol. It is distributed by Physicians Total Care and has a lot number and expiration date. The NDC code for the product is 54868-4811-8. The set of numbers at the bottom (45116640600) is unclear and its significance is unknown.*
Image Of Estradiol 0.1 mg Package Label (Estradiol 0.1 mg Package Label)
Image Of Estradiol Chemical Structure (Estradiol Chemical Structure)
Image Of The Four Layers On Estradiol Patch (Estradiol Comprises Four Layers)
Image Of Figure 1 Mean Serum Graph (Figure 1 Mean Serum Graph)
Image Of Figure 2 Observed Mean Graph (Figure 2 Observed Mean Graph)
Image Of Figure 3 Mean Percent Graph (Figure 3 Mean Percent Graph)
This appears to be a table or graph displaying changes or results over a certain period of time, including different visit/treatment intervals and baseline measures. It's not clear what the units of measurement are or what exactly is being measured, so without more context it's difficult to provide a more specific description.*
Image Of Figure 4 Mean Percent Graph (Figure 4 Mean Percent Graph)
The text seems to be presenting data about changes in some kind of treatment or experiment. It indicates a "baseline" and subsequent check-ins at 6, 12, and 18 months. There are measurements or data presented for a treatment group and a placebo group. However, without further information or context, it is not possible to discern what the experiment or treatment was investigating.*
Image Of Estradiol Patch Being Torn From Top To Bottom (Tearing Estradiol Patch From Top)
* These product label images have been analyzed using experimental machine learning. Please verify findings with the primary label text.