Uroxatral
Product Images NDC 54868-5046

9 FDA label images from Physicians Total Care, Inc. · Packaging, Regulatory Labels, and Product Appearance

Product Visual Gallery

This gallery contains 9 technical images submitted to the FDA as part of the official labeling for Uroxatral (NDC 54868-5046). Unlike standard consumer photos, these assets often include clinical data figures, molecular chemical structures, and official manufacturer packaging layouts.

As provided by Physicians Total Care, Inc., these visuals offer a comprehensive scientific overview of the product's physical and chemical identity, aiding pharmacists and researchers in product verification and study.

FDA Label Image

Principal Display Panel (10 mg Tablet Label)

Principal Display Panel (10 mg Tablet Label)
Uroxatral 10 mg extended-release tablets, labeled by Physicians Total Care, Inc., with a package containing 30 tablets. The label includes dosage information, caution about prescription requirements, and storage instructions. It also features the company logo and product NDC 54868-5046.*
FDA Label Image

Chemical Structure (Uroxatral 01)

Chemical Structure (Uroxatral 01)
Chemical structure of the active ingredient in Uroxatral, showing a molecular diagram including a fused ring system with amino, methoxy groups, a side chain with nitrogen and carbon atoms, and a hydrochloride (HCl) component.*
FDA Label Image

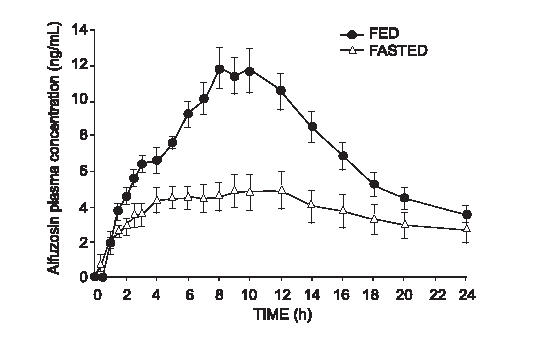
Figure 1 (Uroxatral 02)

Figure 1 (Uroxatral 02)
A line graph showing alfuzosin plasma concentration (ng/mL) over 24 hours, comparing fed and fasted states. The concentration is higher in the fed state throughout, peaking around 10 hours, while the fasted state shows lower concentrations with an earlier plateau.*
FDA Label Image

Figure 2 (Uroxatral 03)

Figure 2 (Uroxatral 03)
A line graph comparing mean change over days of treatment (0, 28, 56, 84) between Uroxatral and placebo groups. The Uroxatral group (N=170) shows a greater decrease over time compared to the placebo group (N=167). Statistical significance is indicated at day 84 with p < 0.001.*
FDA Label Image

Figure 3 (Uroxatral 04)

Figure 3 (Uroxatral 04)
A line graph comparing mean change over days of treatment between Uroxatral (N=137) and placebo (N=152). The x-axis represents days of treatment (0, 28, 56, 84), and the y-axis shows mean change, with values decreasing below zero. Uroxatral shows a greater reduction over time compared to placebo, with statistical significance indicated at p < 0.01.*
FDA Label Image

Figure 4 (Uroxatral 05)

Figure 4 (Uroxatral 05)
Line graph comparing mean change over 84 days of treatment between placebo (150 participants) and Uroxatral (151 participants). The graph shows greater mean change reduction in the Uroxatral group compared to placebo, with data points marked at days 0, 28, 56, and 84. Statistical significance is indicated with ** p < 0.01.*
FDA Label Image

Figure 5 (Uroxatral 06)

Figure 5 (Uroxatral 06)
A line graph depicting the mean change in mL/s over days of treatment for Uroxatral versus placebo. The X-axis shows days of treatment (0, 28, 56, 84), and the Y-axis shows mean change in mL/s (0 to 3). Uroxatral shows a marked increase in mean change by day 28, which is sustained through day 84. Placebo shows minimal change throughout. Statistical significance with p < 0.001 is noted at day 84.*
FDA Label Image

Figure 6 (Uroxatral 07)

Figure 6 (Uroxatral 07)
A line graph comparing mean change in mL/s over days of treatment (0, 14, 28, 56, 84) between placebo (N=147) and Uroxatral (N=136). Uroxatral shows greater mean change than placebo throughout the study, with statistically significant difference at day 84 (p < 0.05).*
FDA Label Image

Figure 7 (Uroxatral 08)

Figure 7 (Uroxatral 08)
A line graph comparing mean change in mL/s over days of treatment for Uroxatral (N=151) versus placebo (N=150). The x-axis shows days of treatment (0, 14, 28, 56, 84), and the y-axis shows mean change in mL/s from 0 to 3. Uroxatral's trend shows an initial increase peaking around day 28, then a slight decline but remaining above placebo throughout. Placebo shows a more modest increase peaking around day 28 and then gradually decreasing. The graph notes NS p > 0.05 indicating non-significant differences.*

* About these descriptions: Image descriptions on this page are generated by automated AI analysis of the product label images from the manufacturer's FDA label submission (SPL). They are provided for reference only and may contain errors or omissions. Always rely on the printed label itself and the official FDA labeling, and consult a pharmacist or healthcare professional with any questions about this product.