Avodart
Product Images NDC 54868-5114

9 FDA label images from Physicians Total Care, Inc. · Packaging, Regulatory Labels, and Product Appearance

Product Visual Gallery

This gallery contains 9 technical images submitted to the FDA as part of the official labeling for Avodart (NDC 54868-5114). Unlike standard consumer photos, these assets often include clinical data figures, molecular chemical structures, and official manufacturer packaging layouts.

As provided by Physicians Total Care, Inc., these visuals offer a comprehensive scientific overview of the product's physical and chemical identity, aiding pharmacists and researchers in product verification and study.

FDA Label Image

Dutasteride Structural Formula (12b15be8 C3de 4732 B9a7 1c06c5e6c385 01)
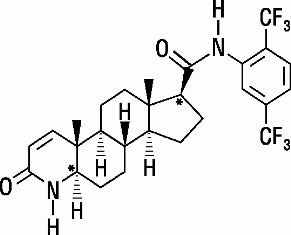
Dutasteride Structural Formula (12b15be8 C3de 4732 B9a7 1c06c5e6c385 01)
Chemical structure of the active ingredient in Avodart, showing molecular bonds and functional groups typical of a complex organic compound.*
FDA Label Image

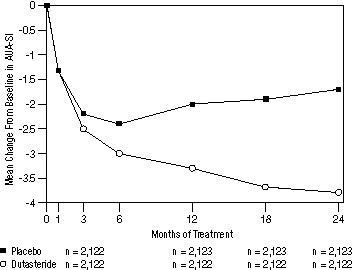
Figure 1. Aua-si Score* Change From Baseline (randomized, Double-blind, Placebo-controlled Studies Pooled) (12b15be8 C3de 4732 B9a7 1c06c5e6c385 02)

Figure 1. Aua-si Score* Change From Baseline (randomized, Double-blind, Placebo-controlled Studies Pooled) (12b15be8 C3de 4732 B9a7 1c06c5e6c385 02)
A line graph showing mean change from baseline in AUASI over 24 months of treatment comparing Avodart (Dutasteride) to placebo. The x-axis represents months of treatment (0 to 24), and the y-axis shows mean change with Avodart showing a greater reduction over time compared to placebo. Sample sizes for each time point are labeled below the x-axis.*
FDA Label Image

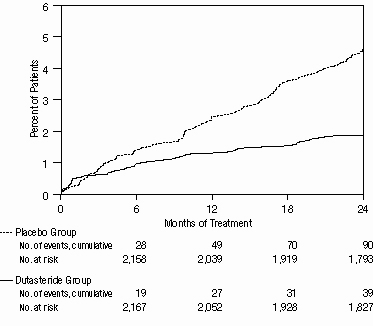
Figure 2. Percent Of Subjects Developing Acute Urinary Retention Over A 24-month Period (randomized, Double-blind, Placebo-controlled Studies Pooled) (12b15be8 C3de 4732 B9a7 1c06c5e6c385 03)

Figure 2. Percent Of Subjects Developing Acute Urinary Retention Over A 24-month Period (randomized, Double-blind, Placebo-controlled Studies Pooled) (12b15be8 C3de 4732 B9a7 1c06c5e6c385 03)
A cumulative incidence line graph comparing the percentage of patients over 24 months of treatment between a placebo group and a dutasteride group. The x-axis represents months of treatment, and the y-axis represents the percent of patients. The placebo group shows a higher cumulative percentage of events than the dutasteride group.*
FDA Label Image

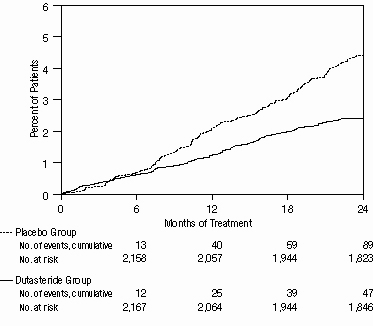
Figure 3. Percent Of Subjects Having Surgery For Benign Prostatic Hyperplasia Over A 24-month Period (randomized, Double-blind, Placebo-controlled Studies Pooled) (12b15be8 C3de 4732 B9a7 1c06c5e6c385 04)

Figure 3. Percent Of Subjects Having Surgery For Benign Prostatic Hyperplasia Over A 24-month Period (randomized, Double-blind, Placebo-controlled Studies Pooled) (12b15be8 C3de 4732 B9a7 1c06c5e6c385 04)
A cumulative event plot comparing the placebo group and dutasteride group over 24 months of treatment. The y-axis shows the proportion of patients, and the x-axis shows months of treatment. The chart includes event counts and number at risk for both groups at various time points.*
FDA Label Image

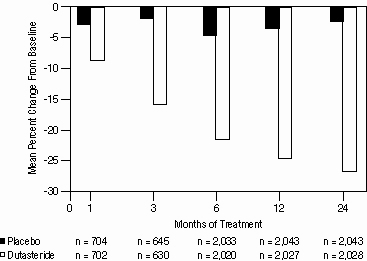
Figure 4. Prostate Volume Percent Change From Baseline (randomized, Double-blind, Placebo-controlled Studies Pooled) (12b15be8 C3de 4732 B9a7 1c06c5e6c385 05)

Figure 4. Prostate Volume Percent Change From Baseline (randomized, Double-blind, Placebo-controlled Studies Pooled) (12b15be8 C3de 4732 B9a7 1c06c5e6c385 05)
A bar chart depicting mean percent change from baseline over months of treatment (0,1,3,6,12,24) for two groups: Placebo and Dutasteride. The x-axis shows treatment months and the y-axis shows mean percent change. Sample sizes (n) for each group at each time point are listed below the chart.*
FDA Label Image

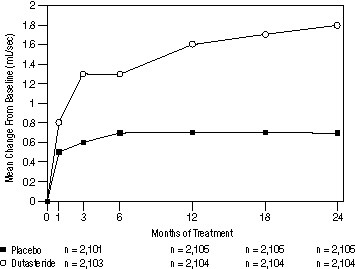
Figure 5. Qmax Change From Baseline (randomized, Double-blind, Placebo-controlled Studies Pooled) (12b15be8 C3de 4732 B9a7 1c06c5e6c385 06)

Figure 5. Qmax Change From Baseline (randomized, Double-blind, Placebo-controlled Studies Pooled) (12b15be8 C3de 4732 B9a7 1c06c5e6c385 06)
This line graph compares mean change from baseline in urine flow rate (mL/sec) over 24 months of treatment with Dutasteride versus Placebo. It includes data points at 0, 3, 6, 12, 18, and 24 months, with Dutasteride showing a greater increase over time compared to Placebo.*
FDA Label Image

Figure 6. (12b15be8 C3de 4732 B9a7 1c06c5e6c385 07)

Figure 6. (12b15be8 C3de 4732 B9a7 1c06c5e6c385 07)
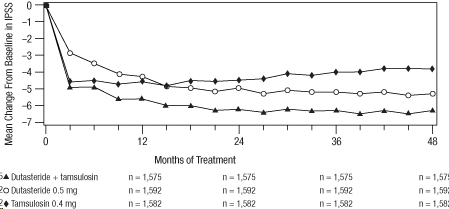
A line graph depicting the mean change from baseline in PSA levels over 48 months of treatment for Dutasteride 0.5 mg, Tamsulosin 0.4 mg, and their combination. The x-axis represents months of treatment (0 to 48), and the y-axis shows mean change from baseline with values decreasing below zero. Three distinct lines represent each treatment group, with sample sizes noted at various time points.*
FDA Label Image

Figure 7. Q-max Change Ffrom Baseline Over A 24-month Period (randomized, Double-blind, Parallel Group Study [combat Study]) (12b15be8 C3de 4732 B9a7 1c06c5e6c385 08)

Figure 7. Q-max Change Ffrom Baseline Over A 24-month Period (randomized, Double-blind, Parallel Group Study [combat Study]) (12b15be8 C3de 4732 B9a7 1c06c5e6c385 08)
A line graph depicting the mean change from baseline in mL/sec over 24 months of treatment for three groups: Dutasteride + tamsulosin, Dutasteride 0.5 mg, and Tamsulosin 0.4 mg. The x-axis shows months of treatment (0, 6, 12, 18, and 24), and the y-axis shows mean change from baseline in mL/sec (0.0 to 3.0). Sample sizes for each group at different time points are indicated below the x-axis.*
FDA Label Image

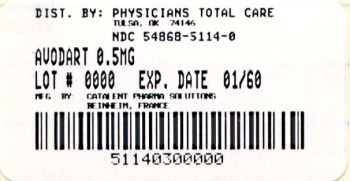
Avodart 0.5 mg Capsules Label (5114)

Avodart 0.5 mg Capsules Label (5114)
Packaging label for Avodart 0.5 mg distributed by Physicians Total Care, Inc., Tulsa, OK. The label includes the product NDC 54868-5114-0, lot number 0000, and an expiration date of 01/60. The manufacturing location is stated as Continent Pharm Solutions, Reims, France, and a barcode is present.*

* About these descriptions: Image descriptions on this page are generated by automated AI analysis of the product label images from the manufacturer's FDA label submission (SPL). They are provided for reference only and may contain errors or omissions. Always rely on the printed label itself and the official FDA labeling, and consult a pharmacist or healthcare professional with any questions about this product.