Image Of 15 mL Package Label (5327)
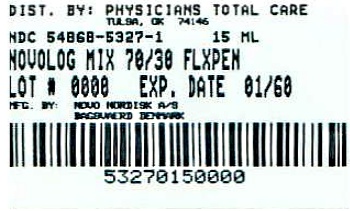
This is a label for a medication that has been distributed by Physicians Total Care. The NDC number is 54B6B-5327-1 and the package contains 15 units. The lot number is 4 6600 with an expiration date of 01768. The rest of the text is not readable.*