Fosamax Plus D
Product Images NDC 54868-5480

6 FDA label images from Physicians Total Care, Inc. · Packaging, Regulatory Labels, and Product Appearance

Product Visual Gallery

This gallery contains 6 technical images submitted to the FDA as part of the official labeling for Fosamax Plus D (NDC 54868-5480). Unlike standard consumer photos, these assets often include clinical data figures, molecular chemical structures, and official manufacturer packaging layouts.

As provided by Physicians Total Care, Inc., these visuals offer a comprehensive scientific overview of the product's physical and chemical identity, aiding pharmacists and researchers in product verification and study.

FDA Label Image

Image Of Alendronate Sodium Structural Formula (Fa0d9712 Ce91 405d 9cfe B617cae9c892 01)
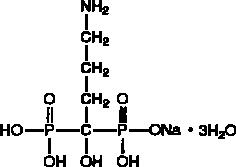
Image Of Alendronate Sodium Structural Formula (Fa0d9712 Ce91 405d 9cfe B617cae9c892 01)
Chemical structure diagram showing the molecular structure of the active ingredient in FOSAMAX PLUS D, a bisphosphonate compound, including phosphate groups, carbon chains, and associated sodium and water molecules.*
FDA Label Image

Image Of Cholecalciferol Structural Formula (Fa0d9712 Ce91 405d 9cfe B617cae9c892 02)

Image Of Cholecalciferol Structural Formula (Fa0d9712 Ce91 405d 9cfe B617cae9c892 02)
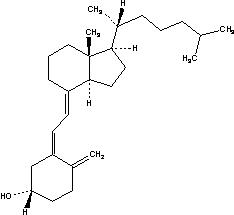
Chemical structure diagram of the active ingredient in FOSAMAX PLUS D showing molecular bonds and functional groups.*
FDA Label Image

Image Of Figure 1 (Fa0d9712 Ce91 405d 9cfe B617cae9c892 03)

Image Of Figure 1 (Fa0d9712 Ce91 405d 9cfe B617cae9c892 03)
A cumulative incidence graph comparing Fosamax and placebo over a 36-month period. The y-axis shows cumulative incidence percentage, while the x-axis represents time in months. The graph displays two lines: one for placebo and one for Fosamax, indicating different rates of cumulative incidence over time.*
FDA Label Image

Image Of Figure 2 (Fa0d9712 Ce91 405d 9cfe B617cae9c892 04)

Image Of Figure 2 (Fa0d9712 Ce91 405d 9cfe B617cae9c892 04)
A bar graph comparing mean increases in BMD (Bone Mineral Density) relative to placebo at three body sites—Lumbar Spine, Femoral Neck, and Trochanter—between U.S. and Multinational groups. The graph shows higher mean increases at the Lumbar Spine for the U.S. group compared to the multinational group, with similar relative increases at the other sites.*
FDA Label Image

Image Of Figure 3 (Fa0d9712 Ce91 405d 9cfe B617cae9c892 05)

Image Of Figure 3 (Fa0d9712 Ce91 405d 9cfe B617cae9c892 05)
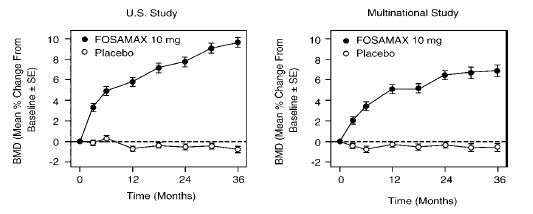
Two line graphs comparing bone mineral density (BMD) percentage change from baseline over 36 months between FOSAMAX 10 mg and placebo groups. The left graph shows results from a U.S. study, and the right graph from a multinational study. Both show increased BMD with FOSAMAX compared to placebo over time.*
FDA Label Image

Principal Display Panel (BI FOLD CARD, OUTER 70 mg/2800 IU)

Principal Display Panel (BI FOLD CARD, OUTER 70 mg/2800 IU)
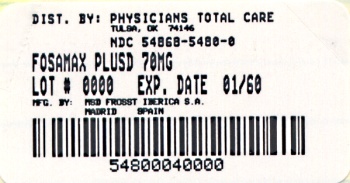
Label for FOSAMAX PLUS D 70MG tablet distributed by Physicians Total Care, Inc., Tulsa, OK. The label shows the product name, strength, lot number, expiration date (01/60), manufacturer Prodesf Iberica S.A. in Madrid, Spain, and a barcode with numeric code 54800040000.*

* About these descriptions: Image descriptions on this page are generated by automated AI analysis of the product label images from the manufacturer's FDA label submission (SPL). They are provided for reference only and may contain errors or omissions. Always rely on the printed label itself and the official FDA labeling, and consult a pharmacist or healthcare professional with any questions about this product.