Axert
Product Images NDC 54868-5527

5 FDA label images from Physicians Total Care, Inc. · Packaging, Regulatory Labels, and Product Appearance

Product Visual Gallery

This gallery contains 5 technical images submitted to the FDA as part of the official labeling for Axert (NDC 54868-5527). Unlike standard consumer photos, these assets often include clinical data figures, molecular chemical structures, and official manufacturer packaging layouts.

As provided by Physicians Total Care, Inc., these visuals offer a comprehensive scientific overview of the product's physical and chemical identity, aiding pharmacists and researchers in product verification and study.

FDA Label Image

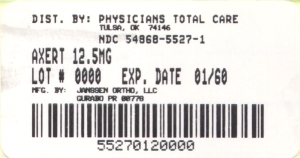
Principal Display Panel (12.5 mg Tablet Carton)
Principal Display Panel (12.5 mg Tablet Carton)
Label for Axert 12.5 mg showing the product name, strength, lot number 000, and expiration date 01/60. Distributed by Physicians Total Care, Inc., Tulsa, OK. Manufacturer is Janssen Ortho, LLC, Gurabo, Puerto Rico. Includes a barcode and product NDC 54868-5527-1.*
FDA Label Image

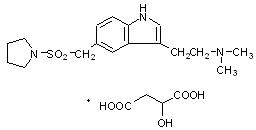
Chemical Structure (Axert 01)

Chemical Structure (Axert 01)
Chemical structure of Axert's active ingredient, as depicted in the molecular diagram showing the specific arrangement of atoms including nitrogen, sulfur, carbon, hydrogen, and oxygen within the molecule and a separate depiction of a molecule containing a dihydroxypropane backbone with two carboxylic acid groups.*
FDA Label Image

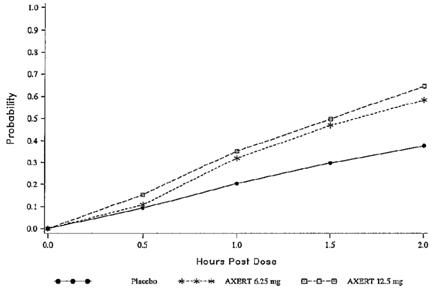
Figure 1 (Axert 02)

Figure 1 (Axert 02)
A line graph depicting probability over hours post dose (0 to 2 hours) comparing Placebo, AXERT 6.25 mg, and AXERT 12.5 mg. The graph shows increasing probability over time, with AXERT 12.5 mg having the highest probability, followed by AXERT 6.25 mg, and Placebo the lowest.*
FDA Label Image

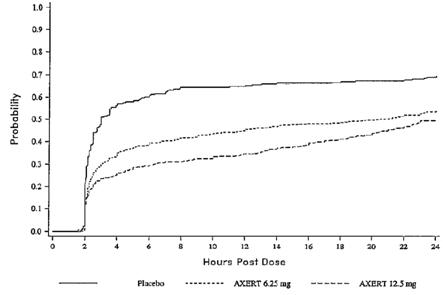
Figure 2 (Axert 03)

Figure 2 (Axert 03)
A line chart showing probability over 24 hours post dose for three groups: Placebo, Axert 6.25 mg, and Axert 12.5 mg. The x-axis represents hours post dose from 0 to 24, and the y-axis represents probability from 0 to 1. The placebo group shows the highest probability, followed by Axert 6.25 mg and Axert 12.5 mg, with Axert 12.5 mg having the lowest probability over time.*
FDA Label Image

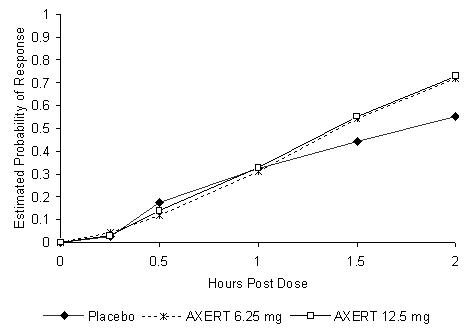
Figure 3 (Axert 04)

Figure 3 (Axert 04)
A line graph showing the estimated probability of response over time (hours post dose) for Placebo, Axert 6.25 mg, and Axert 12.5 mg. The graph illustrates how response probabilities increase from 0 to 2 hours after dosing, with Axert 12.5 mg showing the highest response probability, followed by Axert 6.25 mg and Placebo.*

* About these descriptions: Image descriptions on this page are generated by automated AI analysis of the product label images from the manufacturer's FDA label submission (SPL). They are provided for reference only and may contain errors or omissions. Always rely on the printed label itself and the official FDA labeling, and consult a pharmacist or healthcare professional with any questions about this product.