Megace Es
Product Images NDC 54868-5572

View Photos of Packaging, Regulatory Labels, and Product Appearance

Product Visual Gallery

This gallery contains 4 technical images submitted to the FDA as part of the official labeling for Megace Es (NDC 54868-5572). Unlike standard consumer photos, these assets often include clinical data figures, molecular chemical structures, and official manufacturer packaging layouts.

As provided by Physicians Total Care, Inc., these visuals offer a comprehensive scientific overview of the product's physical and chemical identity, aiding pharmacists and researchers in product verification and study.

FDA Label Image

Image Of Package Label (5572)
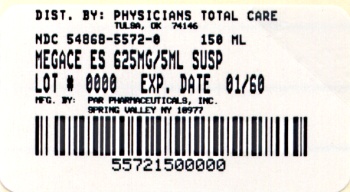
Image Of Package Label (5572)
Label for MEGACE ES 625 mg/5 mL oral suspension distributed by Physicians Total Care, Inc. The label shows a 150 mL bottle, lot number, and expiration date fields. It also mentions the manufacturer as PAR Pharmaceuticals, Inc., Spring Valley, NY. A barcode and the NDC 54868-5572-0 are visible.*
FDA Label Image

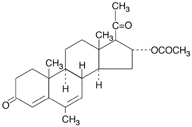
Image Of Chemical Structure (Mol)

Image Of Chemical Structure (Mol)
Chemical structure diagram showing the molecular structure of a corticosteroid compound with multiple rings, methyl groups, and acetate ester functionalities. The image visually represents the arrangement of atoms and bonds in the active ingredient of MEGACE ES by Physicians Total Care, Inc.*
FDA Label Image

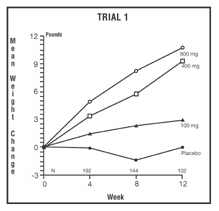
Image Of Trial 1 Graph (Trial1)

Image Of Trial 1 Graph (Trial1)
A line graph titled "TRIAL 1" depicting mean weight change in pounds over 0, 4, 8, and 12 weeks. The graph compares effects of placebo and three dose levels (100 mg, 400 mg, 800 mg), showing weight change increasing with higher doses over time. Sample sizes at weeks 0, 4, 8, and 12 are labeled.*
FDA Label Image

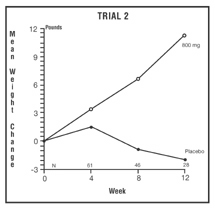
Image Of Trial 2 Graph (Trial2)

Image Of Trial 2 Graph (Trial2)
A line graph titled 'Trial 2' depicting mean weight change over 12 weeks for two groups: one receiving 800 mg of MEGACE ES and the other receiving placebo. The vertical axis measures weight change in pounds from -3 to 12, and the horizontal axis shows weeks at intervals 0, 4, 8, and 12. The 800 mg group shows a steady increase in mean weight, while the placebo group shows a slight decrease over time.*

* About these descriptions: Image descriptions on this page are generated by automated AI analysis of the product label images from the manufacturer's FDA label submission (SPL). They are provided for reference only and may contain errors or omissions. Always rely on the printed label itself and the official FDA labeling, and consult a pharmacist or healthcare professional with any questions about this product.