Chantix
Product Images NDC 54868-5664

7 FDA label images from Physicians Total Care, Inc. · Packaging, Regulatory Labels, and Product Appearance

Product Visual Gallery

This gallery contains 7 technical images submitted to the FDA as part of the official labeling for Chantix (NDC 54868-5664). Unlike standard consumer photos, these assets often include clinical data figures, molecular chemical structures, and official manufacturer packaging layouts.

As provided by Physicians Total Care, Inc., these visuals offer a comprehensive scientific overview of the product's physical and chemical identity, aiding pharmacists and researchers in product verification and study.

FDA Label Image

Image Of Starter Package Label (5664)
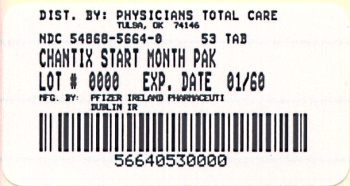
Image Of Starter Package Label (5664)
Packaging label for Chantix Start Month Pak distributed by Physicians Total Care, Inc. It contains 53 tablets and shows the lot number, expiration date, and manufacturer Pfizer Ireland Pharmaceuticals listed in Dublin, Ireland. The National Drug Code (NDC) is 54868-5664-0.*
FDA Label Image

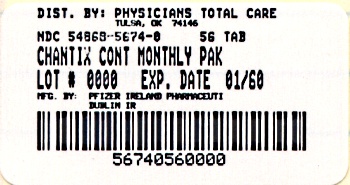
Image Of Continuing Package Label (5674)

Image Of Continuing Package Label (5674)
Label of Chantix container distributed by Physicians Total Care, Inc. The label shows NDC 54868-5674-0, indicating 56 tablets, in a continuous monthly pack. It includes a lot number and an expiration date of 01/60. The manufacturer is Pfizer Ireland Pharmaceuticals.*
FDA Label Image

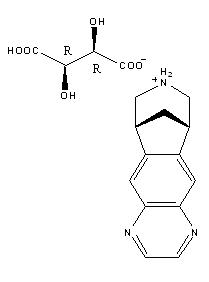
Chemical Structure (Chantix 01)

Chemical Structure (Chantix 01)
Chemical structure diagram showing two molecular structures. The first is a partial structural formula of an amino acid or related compound with hydroxyl and carboxyl groups. The second is a fused bicyclic structure containing nitrogen atoms, consistent with the chemical structure related to the active ingredient of Chantix.*
FDA Label Image

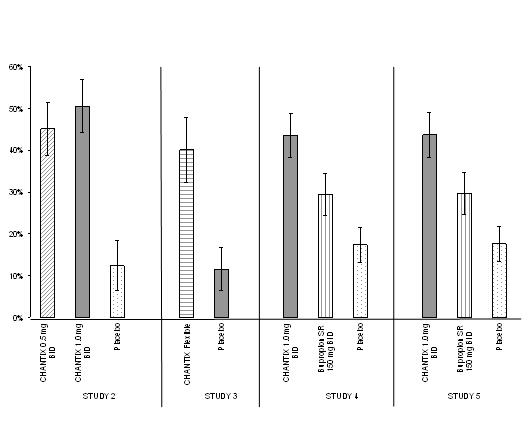
Figure 1 (Chantix 02)

Figure 1 (Chantix 02)
A bar graph comparing the effects of Chantix 0.5 mg, Chantix 1.0 mg, bupropion SR 150 mg BID, and placebo across five studies. The graph shows percentages on the vertical axis and treatment groups on the horizontal axis, with error bars indicating variability.*
FDA Label Image

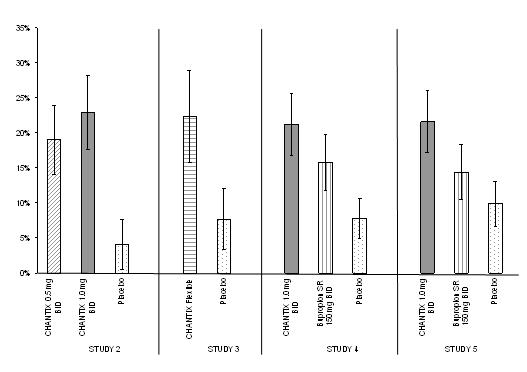
Figure 2 (Chantix 03)

Figure 2 (Chantix 03)
A bar graph comparing the effects of Chantix at various dosages versus placebo across multiple studies (Studies 2, 3, 4, and 5). The vertical axis represents percentage values up to 35%, showing outcome measurements by study and treatment group including Chantix 0.5 mg, 1.0 mg, and placebo.*
FDA Label Image

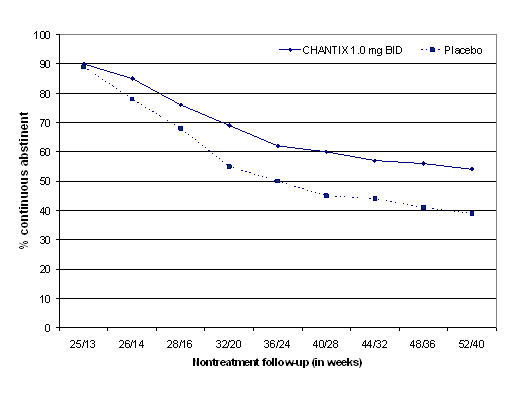
Figure 3 (Chantix 04)

Figure 3 (Chantix 04)
A line graph comparing the percentage of continuous abstinent patients over time during nontreatment follow-up weeks for Chantix 1.0 mg BID versus placebo. The x-axis shows weeks of follow-up, and the y-axis shows the percentage continuously abstinent, with Chantix consistently showing higher abstinence rates than placebo.*
FDA Label Image

Company Logo (Chantix 05)

* About these descriptions: Image descriptions on this page are generated by automated AI analysis of the product label images from the manufacturer's FDA label submission (SPL). They are provided for reference only and may contain errors or omissions. Always rely on the printed label itself and the official FDA labeling, and consult a pharmacist or healthcare professional with any questions about this product.