Precose
Product Images NDC 54868-5831

View Photos of Packaging, Regulatory Labels, and Product Appearance

Product Visual Gallery

This gallery contains 4 technical images submitted to the FDA as part of the official labeling for Precose (NDC 54868-5831). Unlike standard consumer photos, these assets often include clinical data figures, molecular chemical structures, and official manufacturer packaging layouts.

As provided by Physicians Total Care, Inc., these visuals offer a comprehensive scientific overview of the product's physical and chemical identity, aiding pharmacists and researchers in product verification and study.

FDA Label Image

25 mg Tablets (5831)
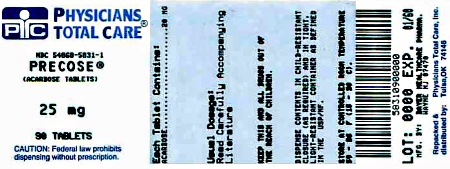
25 mg Tablets (5831)
Label for Precose 25 mg tablets by Physicians Total Care, Inc. The label indicates 90 tablets per container and mentions the active ingredient as acarbose. The label includes cautions about dispensing, storage instructions, lot number, expiration date, and a barcode.*
FDA Label Image

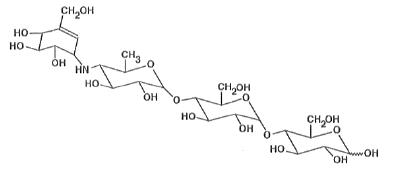
Chemical Structure (A1960c25 9698 4abd 86e7 D863596010ae 01)

Chemical Structure (A1960c25 9698 4abd 86e7 D863596010ae 01)
Chemical structure of the active ingredient in Precose, depicting a complex carbohydrate molecule with multiple hydroxyl groups, amino group, and several sugar rings connected by oxygen bridges, consistent with an alpha-glucosidase inhibitor.*
FDA Label Image

Figure 1 (A1960c25 9698 4abd 86e7 D863596010ae 02)

Figure 1 (A1960c25 9698 4abd 86e7 D863596010ae 02)
A bar chart labeled Figure 1 showing mean change in plasma glucose (mg/dL) following different doses of Precose (25 mg, 50 mg, 100 mg, 200 mg, and 300 mg). Each dose has an associated sample size (N) indicated above the respective bars, and the y-axis represents changes from 0 to -100 mg/dL.*
FDA Label Image

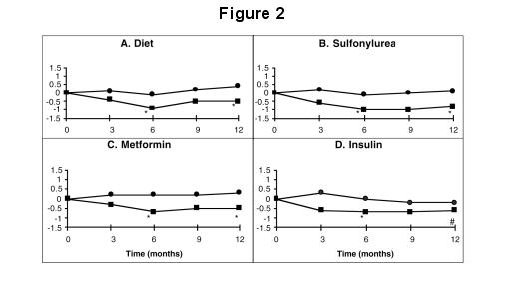
Figure 2 (A1960c25 9698 4abd 86e7 D863596010ae 03)

Figure 2 (A1960c25 9698 4abd 86e7 D863596010ae 03)
Figure 2 consists of four line graphs labeled A to D, showing changes over 12 months in different treatment groups: Diet, Sulfonylurea, Metformin, and Insulin. Each graph plots a variable on the y-axis against time in months on the x-axis, illustrating trends in the respective groups over the study period.*

* About these descriptions: Image descriptions on this page are generated by automated AI analysis of the product label images from the manufacturer's FDA label submission (SPL). They are provided for reference only and may contain errors or omissions. Always rely on the printed label itself and the official FDA labeling, and consult a pharmacist or healthcare professional with any questions about this product.