Alvesco
Product Images NDC 54868-5990

View Photos of Packaging, Regulatory Labels, and Product Appearance

Product Visual Gallery

This gallery contains 8 technical images submitted to the FDA as part of the official labeling for Alvesco (NDC 54868-5990). Unlike standard consumer photos, these assets often include clinical data figures, molecular chemical structures, and official manufacturer packaging layouts.

As provided by Physicians Total Care, Inc., these visuals offer a comprehensive scientific overview of the product's physical and chemical identity, aiding pharmacists and researchers in product verification and study.

FDA Label Image

Package Label (PRINCIPAL DISPLAY PANEL)
Package Label (PRINCIPAL DISPLAY PANEL)
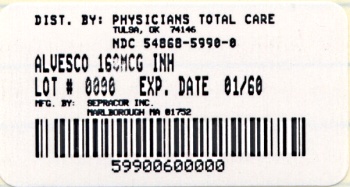
Alvesco 160 MCG inhalation label showing distribution by Physicians Total Care, Inc., Tulsa, OK. The label includes a lot number, expiration date, and a barcode. Manufacturer is listed as Sepracor, Inc., Marlborough, MA.*
FDA Label Image

Package Label (PRINCIPAL DISPLAY PANEL)

Package Label (PRINCIPAL DISPLAY PANEL)
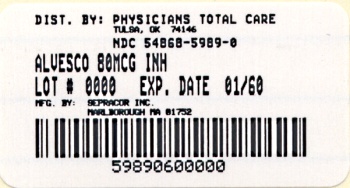
Label for Alvesco 80 mcg inhalation product distributed by Physicians Total Care, Inc. in Tulsa, OK. The label includes lot number 000, expiration date 01/60, and manufacturing details by Sepracor Inc., Marlborough, MA. A barcode is also visible at the bottom.*
FDA Label Image

Structural Formula (Alvesco 01)

Structural Formula (Alvesco 01)
Chemical structure of the active ingredient associated with Alvesco, showing a complex steroid framework with hydroxyl, ketone, and ester functional groups.*
FDA Label Image

Figure 1 (Alvesco 02)

Figure 1 (Alvesco 02)
A line graph titled 'Mean Change from Baseline in FEV1 (L) prior to AM dose' showing mean change in FEV1 over 16 weeks. The x-axis represents weeks (0 to 16), and the y-axis represents mean change in FEV1 (L). Multiple lines represent different treatments including placebo and various Alvesco doses (160 μg once daily, 80 μg twice daily, and 80 μg twice daily transitioning to 160 μg once daily).*
FDA Label Image

Figure 2 (Alvesco 03)

Figure 2 (Alvesco 03)
A line graph showing the mean change from baseline in FEV1 (liters) prior to AM dose over 12 weeks. The graph compares three groups: Placebo, Alvesco 160 µg once daily, and Alvesco 80 µg twice daily, with time (weeks) on the x-axis and mean change in FEV1 on the y-axis.*
FDA Label Image

Figure 3 (Alvesco 04)

Figure 3 (Alvesco 04)
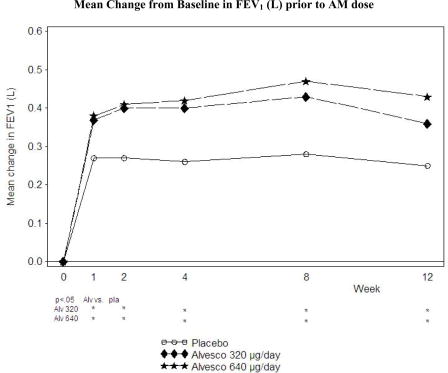
A line graph titled 'Mean Change from Baseline in FEV1 (L) prior to AM dose' displaying mean change in FEV1 (liters) on the y-axis over 12 weeks on the x-axis. The graph compares Placebo and two doses of Alvesco (320 µg/day and 640 µg/day), showing higher FEV1 improvements with Alvesco doses compared to Placebo throughout the study period.*
FDA Label Image

Figure (Alvesco 05)

Figure (Alvesco 05)
An instructional diagram of the Alvesco inhaler showing labeled parts from side and top views, including the canister, actuator, mouthpiece, cap, dose indicator, dose indicator display window, and press area.*
FDA Label Image

Figure (Alvesco 06)

Figure (Alvesco 06)
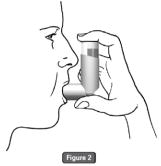
An instructional illustration showing a person using an inhaler, demonstrating the proper hand and mouth positioning to administer a dose. The image focuses on inhaler use technique, relevant to Alvesco inhalation aerosol.*

* About these descriptions: Image descriptions on this page are generated by automated AI analysis of the product label images from the manufacturer's FDA label submission (SPL). They are provided for reference only and may contain errors or omissions. Always rely on the printed label itself and the official FDA labeling, and consult a pharmacist or healthcare professional with any questions about this product.