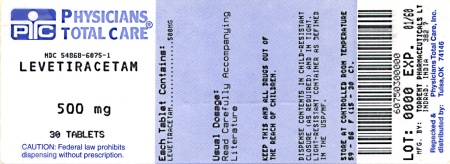
Levetiracetam
Product Images NDC 54868-6076
View Photos of Packaging, Regulatory Labels, and Product Appearance
Product Visual Gallery
This gallery contains 12 technical images submitted to the FDA as part of the official labeling for Levetiracetam (NDC 54868-6076). Unlike standard consumer photos, these assets often include clinical data figures, molecular chemical structures, and official manufacturer packaging layouts.
As provided by Physicians Total Care, Inc., these visuals offer a comprehensive scientific overview of the product's physical and chemical identity, aiding pharmacists and researchers in product verification and study.
Product Images & Figures Index
1000 mg (6076)
750 mg (6269)
Str (Levetiracetamplr Figure 01)
Fig 1 (Levetiracetamplr Figure 02)
Fig 2 (Levetiracetamplr Figure 03)
This appears to be a chart or graph displaying the percentage of patients in a clinical trial for a drug called Levetiracetam and a placebo group. It shows the percentage of patients in each group who were given either a 1000 mg/day or 2000 mg/day dosage. The total number of patients in each group is also shown.*
Fig 3 (Levetiracetamplr Figure 04)
Fig 4 (Levetiracetamplr Figure 05)
Fig 5 (Levetiracetamplr Figure 06)
Fig 6 (Levetiracetamplr Figure 07)
The given text represents the results of an experiment in which two groups were tested - Placebo (N-84) and Levetiracetam (N=79). The percentage values 72.2% and 45.2% are likely to be the effectiveness or success rate of each group. However, since there is no additional information about the experiment or the context in which this data was collected, it is difficult to determine what these percentages represent.*
Logo (Levetiracetamplr Figure 08)
Logo (Levetiracetamplr Figure 09)
* These product label images have been analyzed using experimental machine learning. Please verify findings with the primary label text.