Principal Display Panel (4 mg Tablet Bottle Label)
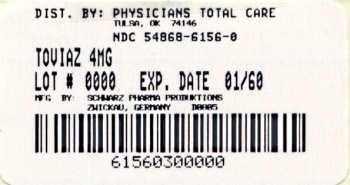
This appears to be the label information for a medication called Toviaz 4G, which is distributed by Ngslclmswvm Care. The NDC and lot/expiry information are also provided on the label. The last line may be a batch or code number.*