Jinteli
Product Images NDC 54868-6251

View Photos of Packaging, Regulatory Labels, and Product Appearance

Product Visual Gallery

This gallery contains 5 technical images submitted to the FDA as part of the official labeling for Jinteli (NDC 54868-6251). Unlike standard consumer photos, these assets often include clinical data figures, molecular chemical structures, and official manufacturer packaging layouts.

As provided by Physicians Total Care, Inc., these visuals offer a comprehensive scientific overview of the product's physical and chemical identity, aiding pharmacists and researchers in product verification and study.

FDA Label Image

Image Of Package Label (6251)
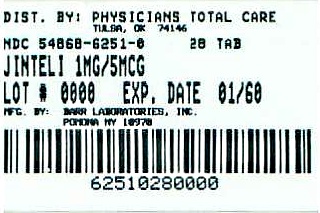
Image Of Package Label (6251)
Label for JINTELI 1 mg/5 mcg tablets distributed by Physicians Total Care, Inc. The label shows the NDC code 54868-6251-0 and indicates a bottle containing 28 tablets. Manufacturer is listed as Banner Laboratories, Inc., Pomona, NY. Lot number and expiration date are also visible.*
FDA Label Image

Chemical Structure (6f5df573 C87b 4b41 B92b 5add9a3a52fc 01)

Chemical Structure (6f5df573 C87b 4b41 B92b 5add9a3a52fc 01)
Chemical structure diagram showing two steroid molecules. The structure on the left is a corticosteroid derivative with acetyl and alkyne groups, while the structure on the right depicts a steroid with hydroxyl groups, likely representing active ingredients related to JINTELI by Physicians Total Care, Inc.*
FDA Label Image

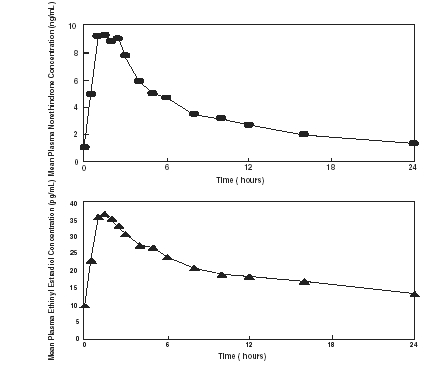
Figure 1 (6f5df573 C87b 4b41 B92b 5add9a3a52fc 02)

Figure 1 (6f5df573 C87b 4b41 B92b 5add9a3a52fc 02)
Two line graphs showing mean plasma concentrations over time. The first graph plots Mean Plasma Monohydroxon concentration (ng/mL) against time (hours) from 0 to 24. The second graph plots Mean Plasma Ethinyl Estradiol concentration (pg/mL) against time (hours), also from 0 to 24 hours.*
FDA Label Image

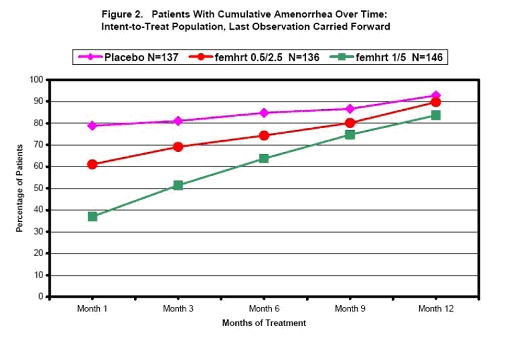
Figure 2 (6f5df573 C87b 4b41 B92b 5add9a3a52fc 03)

Figure 2 (6f5df573 C87b 4b41 B92b 5add9a3a52fc 03)
Line graph titled 'Patients With Cumulative Amenorrhea Over Time' displaying percentage of patients over 12 months of treatment. Three groups are compared: Placebo (N=137), femhrt 0.5/2.5 (N=136), and femhrt 1/5 (N=146). The x-axis shows months of treatment from 1 to 12, and the y-axis shows the percentage of patients from 0% to 100%. Trends indicate increasing cumulative amenorrhea over time for all groups, with Placebo group showing the highest percentage early on, converging with treatment groups by month 12.*
FDA Label Image

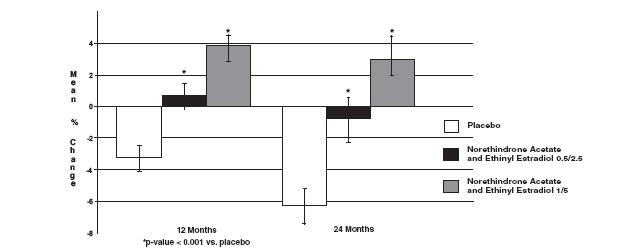
Figure 3 (6f5df573 C87b 4b41 B92b 5add9a3a52fc 04)

Figure 3 (6f5df573 C87b 4b41 B92b 5add9a3a52fc 04)
A bar chart showing mean percentage change over 12 and 24 months for placebo, Norethindrone Acetate and Ethinyl Estradiol 0.5/2.5, and Norethindrone Acetate and Ethinyl Estradiol 1/5 groups. The chart highlights statistical significance at p-value < 0.001 versus placebo with asterisks for the treatment groups.*

* About these descriptions: Image descriptions on this page are generated by automated AI analysis of the product label images from the manufacturer's FDA label submission (SPL). They are provided for reference only and may contain errors or omissions. Always rely on the printed label itself and the official FDA labeling, and consult a pharmacist or healthcare professional with any questions about this product.