Jalyn
Product Images NDC 54868-6328

View Photos of Packaging, Regulatory Labels, and Product Appearance

Product Visual Gallery

This gallery contains 5 technical images submitted to the FDA as part of the official labeling for Jalyn (NDC 54868-6328). Unlike standard consumer photos, these assets often include clinical data figures, molecular chemical structures, and official manufacturer packaging layouts.

As provided by Physicians Total Care, Inc., these visuals offer a comprehensive scientific overview of the product's physical and chemical identity, aiding pharmacists and researchers in product verification and study.

FDA Label Image

Bottle Label (6328)

Bottle Label (6328)
JALYN label showing NDC 54868-6328-0 with lot number 0000 and expiration date 01/60. The label includes a barcode and is distributed by Physicians Total Care, Inc., Tulsa, Oklahoma. The package indicates 30 capsules.*
FDA Label Image

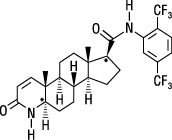
Dutasteride Structural Formula (F4843d40 381d 4bdd 95bd 4712eeadda17 01)

Dutasteride Structural Formula (F4843d40 381d 4bdd 95bd 4712eeadda17 01)
Chemical structure of the active ingredient shown in the image for the JALYN pharmaceutical product by Physicians Total Care, Inc. The structure depicts a complex molecule with multiple rings and substituents, including trifluoromethyl groups.*
FDA Label Image

Tamsulosin Hydrochloride Structural Formula (F4843d40 381d 4bdd 95bd 4712eeadda17 02)

Tamsulosin Hydrochloride Structural Formula (F4843d40 381d 4bdd 95bd 4712eeadda17 02)
Chemical structure diagram showing the molecular composition of the active ingredient in JALYN. The structure features aromatic rings, functional groups including amine, sulfonamide, methoxy, and ethoxy groups, and a hydrochloride (HCl) moiety.*
FDA Label Image

Figure 1 (F4843d40 381d 4bdd 95bd 4712eeadda17 03)

Figure 1 (F4843d40 381d 4bdd 95bd 4712eeadda17 03)
A line graph showing mean change from baseline in IPSS (International Prostate Symptom Score) over 48 months of treatment. The graph compares three treatment groups: Dutasteride plus tamsulosin, Dutasteride 0.5 mg, and Tamsulosin 0.4 mg, with data points plotted monthly alongside the sample sizes for each group.*
FDA Label Image

Figure 2. Qmax Change From Baseline (combat Study) (F4843d40 381d 4bdd 95bd 4712eeadda17 04)

Figure 2. Qmax Change From Baseline (combat Study) (F4843d40 381d 4bdd 95bd 4712eeadda17 04)
A line graph depicting the mean change from baseline in milliliters over 24 months of treatment for three groups: Dutasteride plus tamsulosin, Dutasteride 0.5 mg, and Tamsulosin 0.4 mg. The x-axis represents months of treatment (0, 6, 12, 18, 24), and the y-axis represents mean change in mL. Data points with sample sizes for each group accompany the graph lines.*

* About these descriptions: Image descriptions on this page are generated by automated AI analysis of the product label images from the manufacturer's FDA label submission (SPL). They are provided for reference only and may contain errors or omissions. Always rely on the printed label itself and the official FDA labeling, and consult a pharmacist or healthcare professional with any questions about this product.