Clopidogrel Bisulfate
Product Images NDC 54868-6336

10 FDA label images from Physicians Total Care, Inc. · Packaging, Regulatory Labels, and Product Appearance

Product Visual Gallery

This gallery contains 10 technical images submitted to the FDA as part of the official labeling for Clopidogrel Bisulfate (NDC 54868-6336). Unlike standard consumer photos, these assets often include clinical data figures, molecular chemical structures, and official manufacturer packaging layouts.

As provided by Physicians Total Care, Inc., these visuals offer a comprehensive scientific overview of the product's physical and chemical identity, aiding pharmacists and researchers in product verification and study.

FDA Label Image

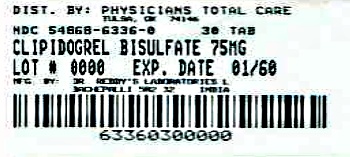
Container (6336)

Container (6336)
Clopidogrel bisulfate 75 mg tablet bottle label from Physicians Total Care, Inc. The label displays the product name, strength, quantity (30 tablets), lot number, expiration date (01/60), and includes a barcode. The NDC code 54868-6336-6 is printed prominently under the distributor information.*
FDA Label Image

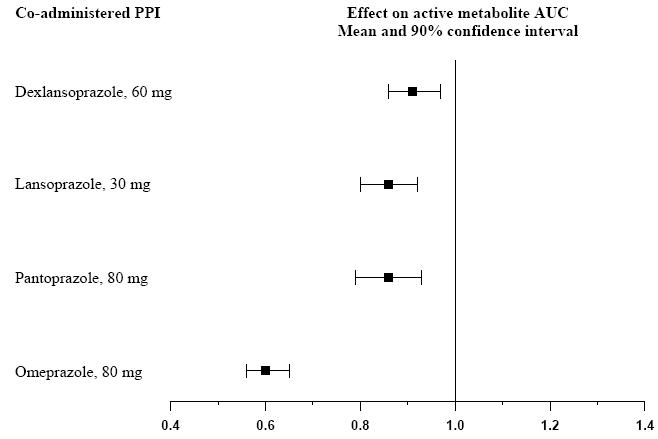
Figure1 (Figure1)

Figure1 (Figure1)
A horizontal bar chart showing the effect of co-administered proton pump inhibitors (PPIs) dexlansoprazole 60 mg, lansoprazole 30 mg, pantoprazole 80 mg, and omeprazole 80 mg on the active metabolite AUC with mean values and 90% confidence intervals. The chart quantifies changes relative to a baseline value of 1.0 on the x-axis ranging from 0.4 to 1.4.*
FDA Label Image

Figure2 (Figure2)

Figure2 (Figure2)
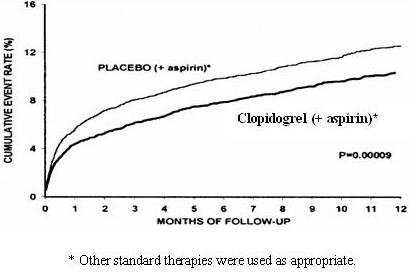
A line graph showing the cumulative event rate (%) over 12 months of follow-up comparing Clopidogrel plus aspirin versus placebo plus aspirin. The graph indicates lower cumulative event rates for Clopidogrel plus aspirin throughout the period. A note mentions that other standard therapies were used as appropriate.*
FDA Label Image

Figure3 (Figure3)

Figure3 (Figure3)
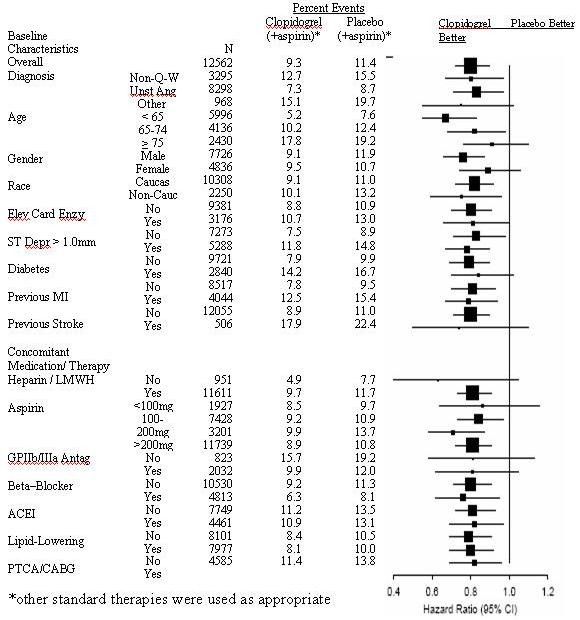
A forest plot presenting hazard ratios with 95% confidence intervals for various baseline characteristics and concomitant medication therapies in patients treated with Clopidogrel bisulfate plus aspirin compared to placebo plus aspirin. The chart categorizes data by diagnosis, age, gender, race, enzymatic evaluation, ST segment depression, diabetes, previous myocardial infarction, previous stroke, and medication use including heparin/LMWH, aspirin at different doses, GPIIb/IIIa antagonists, beta-blockers, ACE inhibitors, lipid-lowering agents, and PTCA/CABG. Each subgroup shows the number of events and compares Clopidogrel and placebo outcomes.*
FDA Label Image

Figure4 (Figure4)

Figure4 (Figure4)
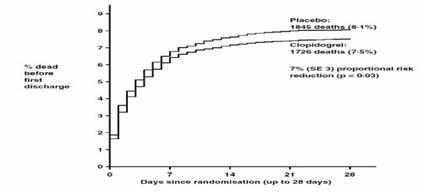
A Kaplan-Meier survival curve showing the percentage of deaths before first discharge over time (days since randomization, up to 28 days) comparing patients receiving placebo versus clopidogrel. The graph includes statistical data noting a 7% proportional risk reduction (p = 0.03) with clopidogrel.*
FDA Label Image

Figure5 (Figure5)

Figure5 (Figure5)
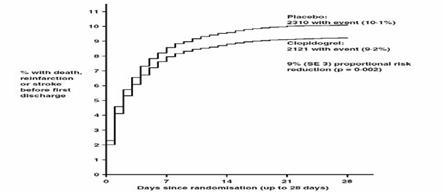
A line graph showing the percentage of patients with death, reinfarction, or strokes before final discharge over days since randomization (up to 28 days). It compares Clopidogrel and placebo, noting a 9% proportional risk reduction with Clopidogrel.*
FDA Label Image

Figure6 (Figure6)

Figure6 (Figure6)
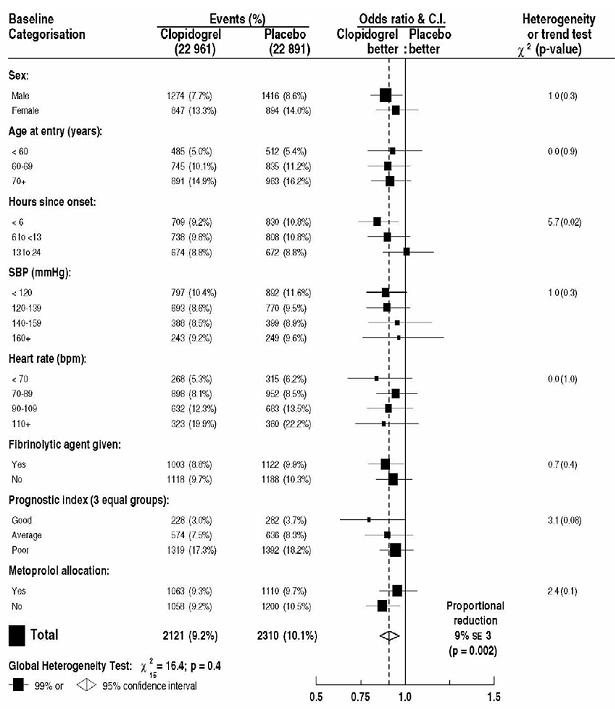
A forest plot chart showing baseline categorization and event percentages comparing Clopidogrel bisulfate (22,961 events) and placebo (22,891 events) across factors such as sex, age, hours since onset, systolic blood pressure, heart rate, fibrinolytic agent use, prognostic index, and metoprolol allocation. The chart displays odds ratios and confidence intervals for each category, with a global heterogeneity test result and proportional reduction statistics.*
FDA Label Image

Figure7 (Figure7)

Figure7 (Figure7)
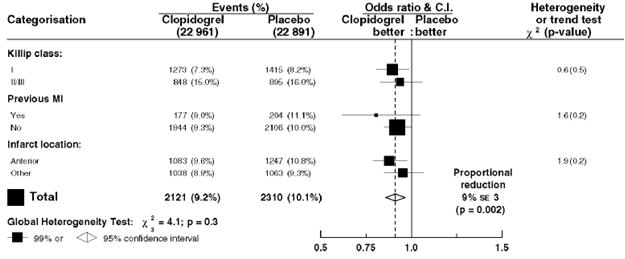
A forest plot comparing event percentages and odds ratios with confidence intervals for Clopidogrel bisulfate versus placebo across various categories: Killip class, previous myocardial infarction (MI), and infarct location. The plot includes a global heterogeneity test and indicates a proportional reduction with Clopidogrel bisulfate.*
FDA Label Image

Figure8 (Figure8)

Figure8 (Figure8)
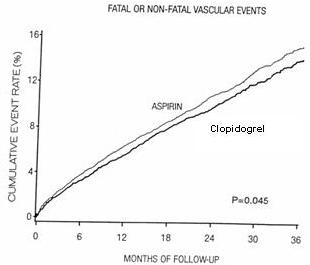
A line graph comparing the cumulative event rate percentage of fatal or non-fatal vascular events over 36 months of follow-up for aspirin and clopidogrel. The x-axis represents months of follow-up, and the y-axis shows cumulative event rate percentage, indicating a statistically significant difference (P=0.045) between the two treatments.*
FDA Label Image

Structure (Structure)

Structure (Structure)
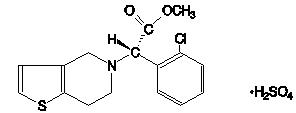
Chemical structure of Clopidogrel bisulfate, showing the molecular framework with functional groups including a thiophene ring, chlorine-substituted phenyl ring, and sulfate ion association.*

* About these descriptions: Image descriptions on this page are generated by automated AI analysis of the product label images from the manufacturer's FDA label submission (SPL). They are provided for reference only and may contain errors or omissions. Always rely on the printed label itself and the official FDA labeling, and consult a pharmacist or healthcare professional with any questions about this product.