Exalgo
Product Images NDC 54868-6387

5 FDA label images from Physicians Total Care, Inc. · Packaging, Regulatory Labels, and Product Appearance

Product Visual Gallery

This gallery contains 5 technical images submitted to the FDA as part of the official labeling for Exalgo (NDC 54868-6387). Unlike standard consumer photos, these assets often include clinical data figures, molecular chemical structures, and official manufacturer packaging layouts.

As provided by Physicians Total Care, Inc., these visuals offer a comprehensive scientific overview of the product's physical and chemical identity, aiding pharmacists and researchers in product verification and study.

FDA Label Image

Principal Display Panel (8 mg)
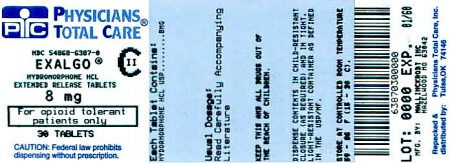
Principal Display Panel (8 mg)
EXALGO 8 mg extended release tablets by Physicians Total Care, labeled for opioid tolerant patients only. The label indicates the package contains 30 tablets and features cautionary information about dispensing restrictions. The label also includes lot number, expiration date, and a barcode.*
FDA Label Image

Principal Display Panel (16 mg)

Principal Display Panel (16 mg)
Packaging label for EXALGO 16 mg extended release tablets by Physicians Total Care, Inc. The label indicates hydromorphone HCl as the active ingredient, designed for opioid-tolerant patients only. The container holds 30 tablets.*
FDA Label Image

Chemical Structure (Exalgo 1)

Chemical Structure (Exalgo 1)
Chemical structure diagram showing the molecular formula of EXALGO (hydromorphone hydrochloride). The structure includes multiple ring systems, hydroxyl, ketone groups, and a hydrochloride (HCl) component.*
FDA Label Image

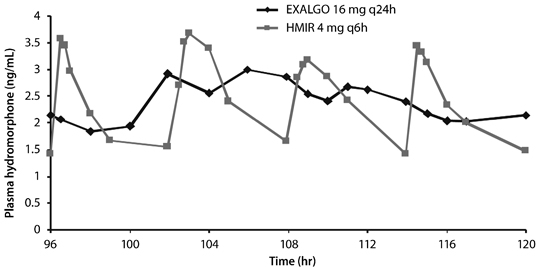
Mean Steady-state Plasma Concentration Profile (Exalgo 2)

Mean Steady-state Plasma Concentration Profile (Exalgo 2)
A line graph comparing plasma hydromorphone concentration (ng/mL) over time (hours) for two formulations: EXALGO 16 mg administered every 24 hours and HMIR 4 mg administered every 6 hours. The graph shows fluctuating plasma levels across the 96 to 120 hour time period.*
FDA Label Image

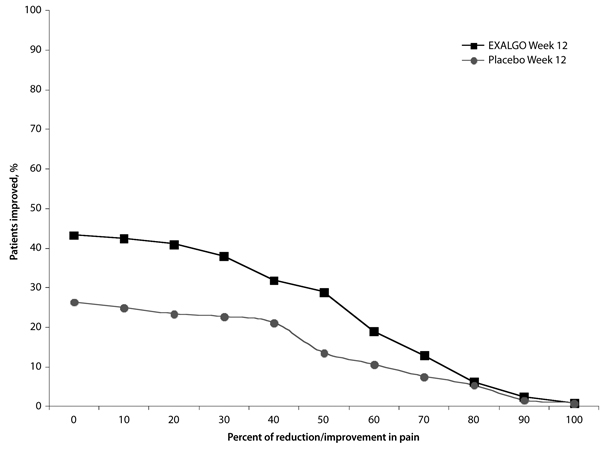
Percent Reduction In Average Pain Intensity From Screening To Week 12 Or Final Visit (Exalgo 3)

Percent Reduction In Average Pain Intensity From Screening To Week 12 Or Final Visit (Exalgo 3)
A line graph comparing the percentage of patients improved versus percent of reduction/improvement in pain for EXALGO and placebo at week 12. The graph shows two lines: EXALGO (black squares) and placebo (gray circles), indicating higher patient improvement percentages with EXALGO across various pain reduction levels.*

* About these descriptions: Image descriptions on this page are generated by automated AI analysis of the product label images from the manufacturer's FDA label submission (SPL). They are provided for reference only and may contain errors or omissions. Always rely on the printed label itself and the official FDA labeling, and consult a pharmacist or healthcare professional with any questions about this product.