Valsartan And Hydrochlorothiazide
Product Images NDC 54868-6440
View Photos of Packaging, Regulatory Labels, and Product Appearance
Product Visual Gallery
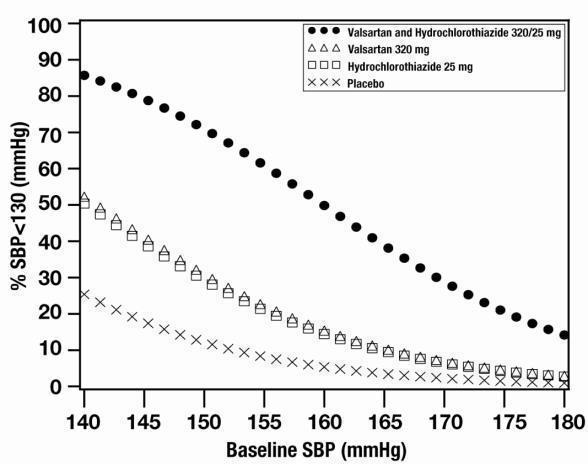
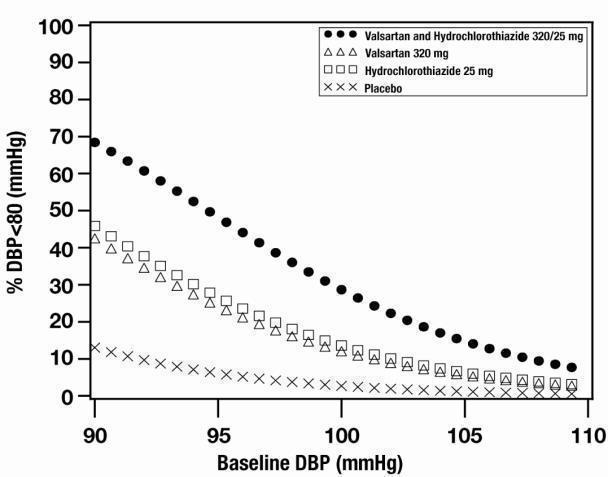
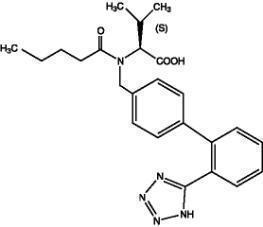
This gallery contains 7 technical images submitted to the FDA as part of the official labeling for Valsartan And Hydrochlorothiazide (NDC 54868-6440). Unlike standard consumer photos, these assets often include clinical data figures, molecular chemical structures, and official manufacturer packaging layouts.
As provided by Physicians Total Care, Inc., these visuals offer a comprehensive scientific overview of the product's physical and chemical identity, aiding pharmacists and researchers in product verification and study.
Product Images & Figures Index
Figure 1: Probability Of Achieving Systolic Blood Pressure <140 Mmhg At Week 8 (Valsartan Hct 1)
Figure 2: Probability Of Achieving Diastolic Blood Pressure <90 Mmhg At Week 8 (Valsartan Hct 2)
Figure 3: Probability Of Achieving Systolic Blood Pressure <130 Mmhg At Week 8 (Valsartan Hct 3)
This is a table showing the results of a clinical study for a medication called Valsartan and Hydrochlorothiazide. The medication was given to participants in different dosages, and the effect on systolic blood pressure (SBP) was measured over time. The left column shows the baseline SBP readings of the participants, while the top row shows the different dosage levels given. Any additional information or description is not available from the given text.*
Figure 4: Probability Of Achieving Diastolic Blood Pressure <80 Mmhg At Week 8 (Valsartan Hct 4)
This is a graph representing the baseline diastolic blood pressure (DBP) in mmHg of patients taking Valsartan and Hydrochlorothiazide at different doses. The graph ranges from 0 to 110 on the x-axis and 0 to 100 on the y-axis, with different labels for each axis point. There is also a placebo group, represented by the label "Sol XXX Placebo."*
Valsartan Chemical Structure (Valsartan Hct 5)
Hydrochlorothiazide Chemical Structure (Valsartan Hct 6)
* These product label images have been analyzed using experimental machine learning. Please verify findings with the primary label text.