Letrozole Tablet, Film Coated
Product Images NDC 55111-646

8 FDA label images from Dr. Reddy's Laboratories Limited · Packaging, Regulatory Labels, and Product Appearance

Product Visual Gallery

This gallery contains 8 technical images submitted to the FDA as part of the official labeling for Letrozole (NDC 55111-646). Unlike standard consumer photos, these assets often include clinical data figures, molecular chemical structures, and official manufacturer packaging layouts.

As provided by Dr. Reddy's Laboratories Limited, these visuals offer a comprehensive scientific overview of the product's physical and chemical identity, aiding pharmacists and researchers in product verification and study.

FDA Label Image

Carton (Carton)

Carton (Carton)
Carton packaging for Letrozole Tablets USP, 2.5 mg film-coated tablets by Dr. Reddy's Laboratories Limited. The package contains 100 tablets in unit-dose blister cards (10 cards with 10 tablets each). The label includes storage instructions, dosage directions to see package insert, and batch details. Manufactured in Visakhapatnam, India.*
FDA Label Image

Container (Container)

Container (Container)
Letrozole Tablets USP, 2.5 mg, oral film-coated tablets in a package of 30 by Dr. Reddy's Laboratories Limited. The label includes storage instructions to keep the drug at 20-25°C and warnings to keep out of reach of children. The NDC number 55111-646-30 is visible along with a barcode and manufacturing location in Visakhapatnam, India.*
FDA Label Image

Figure1 (Figure1)

Figure1 (Figure1)
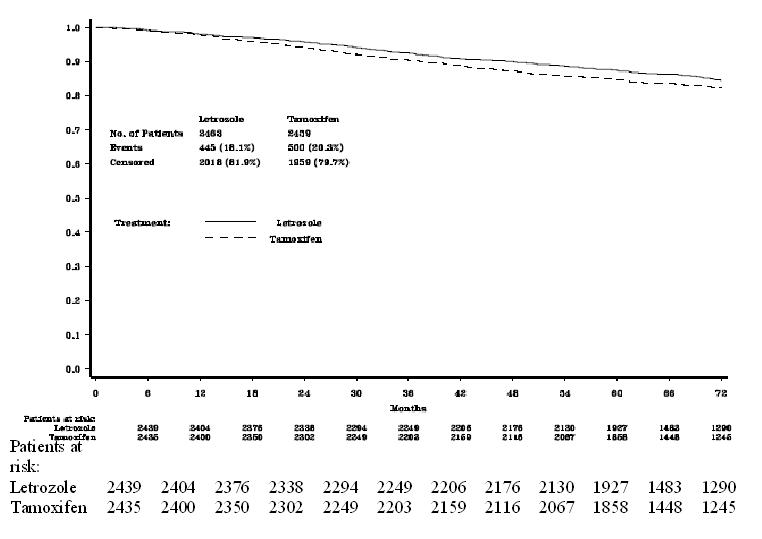
A survival curve plot comparing Letrozole and Tamoxifen treatments over 72 months. The y-axis represents survival probability (0 to 1), and the x-axis shows time in months from 0 to 72. Two lines represent treatments: a solid line for Letrozole and a dashed line for Tamoxifen, both showing slight decline over time. Patient counts at risk for each treatment are listed below the graph at various time points, along with the number of patients, events, and censored data summarized in the upper left.*
FDA Label Image

Figure2 (Figure2)

Figure2 (Figure2)
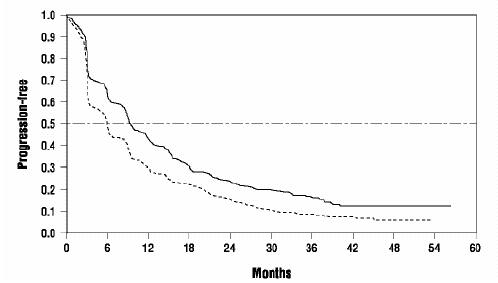
A line graph displaying progression-free survival over time in months. The y-axis represents the proportion progression-free ranging from 0.0 to 1.0, and the x-axis represents months from 0 to 60. Two lines illustrate different progression-free survival trends over the time period.*
FDA Label Image

Figure3 (Figure3)

Figure3 (Figure3)
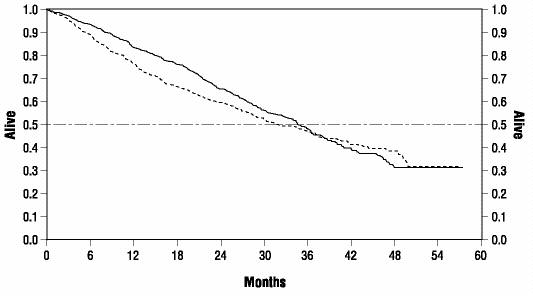
A survival curve graph showing the proportion of subjects alive over time in months up to 60 months. The graph features two survival curves represented by solid and dashed lines, illustrating comparative survival trends.*
FDA Label Image

Figure4 (Figure4)

Figure4 (Figure4)
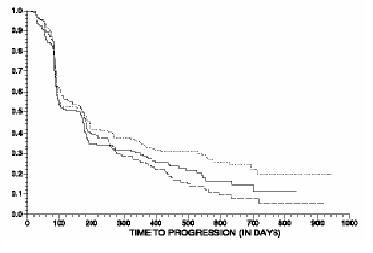
A Kaplan-Meier survival curve graph showing time to progression in days on the x-axis and the progression-free proportion on the y-axis. Multiple lines indicate different patient groups or treatment arms, with progression rates decreasing over time up to around 1400 days.*
FDA Label Image

Figure5 (Figure5)

Figure5 (Figure5)
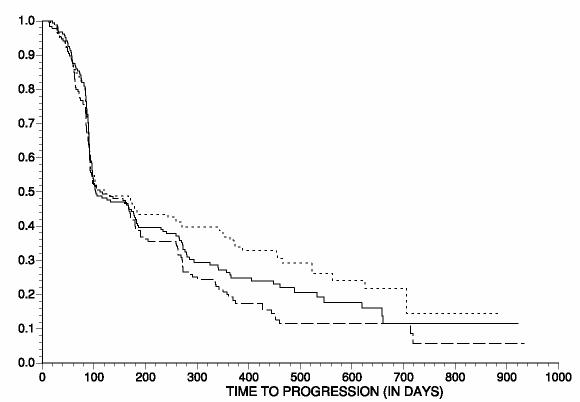
A line graph depicting time to progression in days on the x-axis and a survival or progression proportion on the y-axis. The graph shows multiple stepped lines indicating different progression rates over nearly 1000 days.*
FDA Label Image

Structure (Structure)

Structure (Structure)
Chemical structure of letrozole, showing its molecular arrangement with a triazole ring connected to two cyanophenyl groups.*

* About these descriptions: Image descriptions on this page are generated by automated AI analysis of the product label images from the manufacturer's FDA label submission (SPL). They are provided for reference only and may contain errors or omissions. Always rely on the printed label itself and the official FDA labeling, and consult a pharmacist or healthcare professional with any questions about this product.