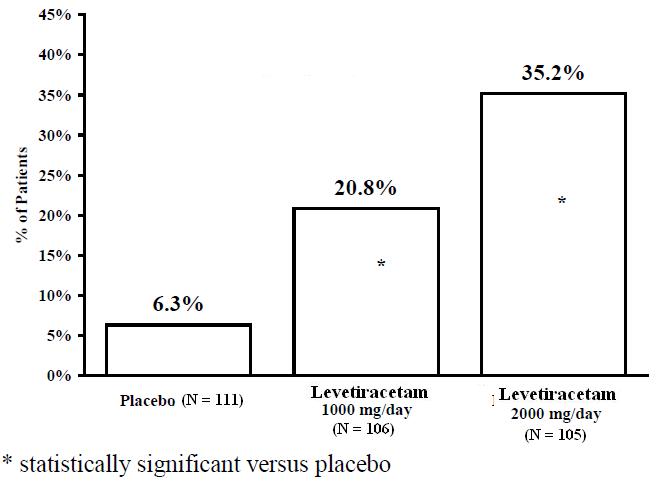
Figure 1: Responder Rate (≥50% Reduction From Baseline) In Study 1 (Levetiracetam Fig1)
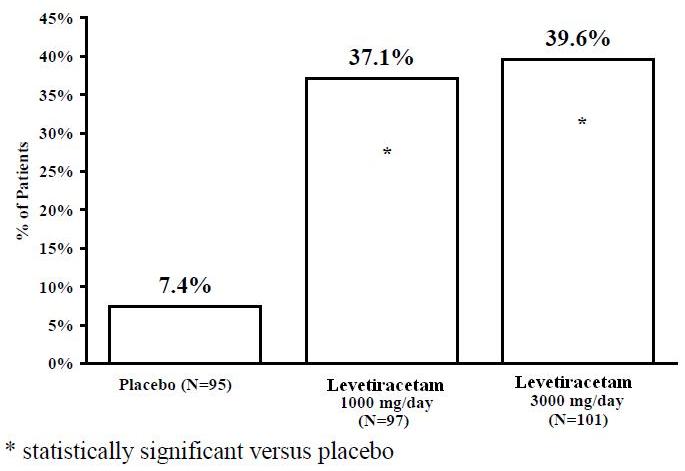
The text shows the results of a study in which the drug Levetiracetam was tested at two different doses (1000 mg/day and 3000 mg/day) compared to a placebo group (N=95). The percentages indicate the proportion of participants who benefited from the treatment, with the highest percentage being 39.6% for one of the Levetiracetam groups. The asterisk denotes that the Levetiracetam groups had statistically significant results compared to the placebo group.*