Figure 1. Relationship At Steady State Between Argatroban Dose, Plasma Argatroban Concentration And Anticoagulant Effect (Argatroban Fig1)
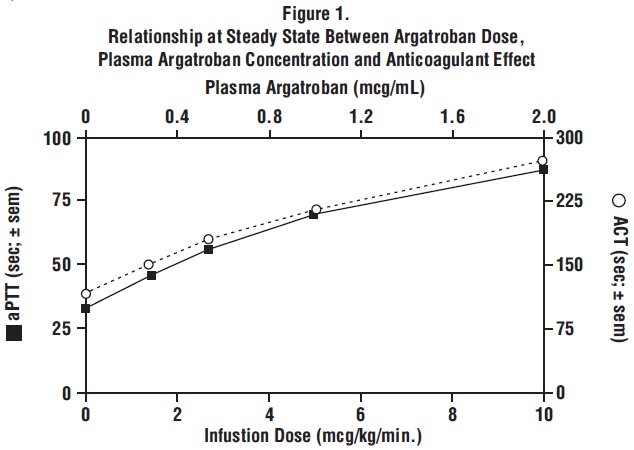
This is a graph showing the relationship at steady state between Argatroban dose, Plasma Argatroban concentration and anticoagulant effect. The x-axis shows Plasma Argatroban levels in mega per milliliter, ranging from 0 to 2.0 mega per milliliter. The y-axis shows infusion dose in mega per kg per minute, ranging from 0 to 10 mega per kg per minute. The graph shows the anticoagulant effect of Argatroban with increasing doses and plasma concentrations. There is additional text, possibly corrupted during , which is not providing any useful information.*