Bortezomib Injection, Powder, Lyophilized, For Solution
Product Images NDC 55150-337

View Photos of Packaging, Regulatory Labels, and Product Appearance

Product Visual Gallery

This gallery contains 13 technical images submitted to the FDA as part of the official labeling for Bortezomib (NDC 55150-337). Unlike standard consumer photos, these assets often include clinical data figures, molecular chemical structures, and official manufacturer packaging layouts.

As provided by Eugia Us Llc, these visuals offer a comprehensive scientific overview of the product's physical and chemical identity, aiding pharmacists and researchers in product verification and study.

FDA Label Image

Formula 1 (Bortezomib Fig1)

Formula 1 (Bortezomib Fig1)
A mathematical formula showing the calculation of total Bortezomib injection volume in mL to be administered. It divides the Bortezomib dose (mg/m²) times patient body surface area (m²) by the concentration 1 mg/mL.*
FDA Label Image

Package Label-principal Display Panel-3.5 mg Per Vial (Container-Carton (1 Vial))

Package Label-principal Display Panel-3.5 mg Per Vial (Container-Carton (1 Vial))
Packaging label for Bortezomib for Injection, 3.5 mg per vial, a lyophilized powder for solution intended for intravenous or subcutaneous use. The label indicates it is a single-dose vial and includes instructions to discard unused portions. Distributed by Eugia US LLC and manufactured by Eugia Pharma Specialities Limited. The label features reconstitution information and storage instructions to keep the product between 20° to 25°C.*
FDA Label Image

Package Label-principal Display Panel-3.5 mg Per Vial (Sticker Label)

Package Label-principal Display Panel-3.5 mg Per Vial (Sticker Label)
This label compares preparation instructions for Bortezomib for Injection, highlighting differences between subcutaneous and intravenous routes. It shows dilution volumes of 1.4 mL and 3.5 mL of 0.9% sodium chloride, targeting final concentrations of 2.5 mg/mL and 1 mg/mL respectively. It instructs placing route-specific stickers on vials and syringes and refers to the package insert for full instructions.*
FDA Label Image

Figure 12 (Bortezomib Fig12)

FDA Label Image

Formula 1 (Bortezomib Fig2)

Formula 1 (Bortezomib Fig2)
A mathematical formula detailing the calculation for total Bortezomib injection volume in mL to be administered, based on dose in mg/m², patient body surface area (BSA) in m², and a concentration of 2.5 mg/mL.*
FDA Label Image

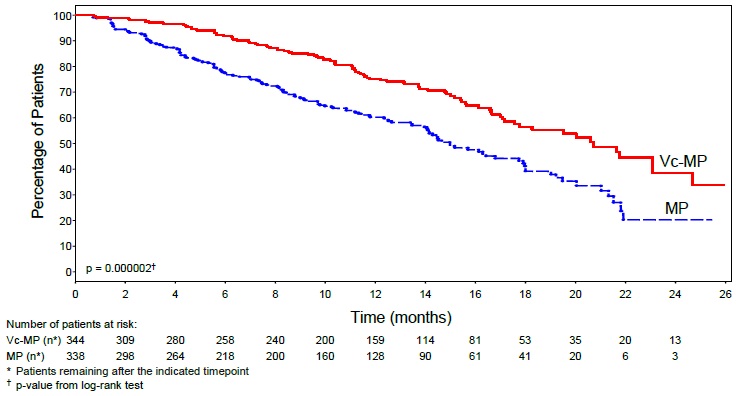
Figure 1: Time To Progression Bortezomib, Melphalan And Prednisone Vs Melphalan And Prednisone (Bortezomib Fig3)

Figure 1: Time To Progression Bortezomib, Melphalan And Prednisone Vs Melphalan And Prednisone (Bortezomib Fig3)
A survival curve chart comparing the percentage of patients over time (in months) between two treatment groups labeled Vc-MP (red line) and MP (blue line). The X-axis represents time in months up to 26, and the Y-axis shows the percentage of patients from 0 to 100. A table beneath the graph indicates the number of patients at risk in each group at various time points, with a statistically significant p-value of 0.000002 from a log-rank test noted in the bottom left.*
FDA Label Image

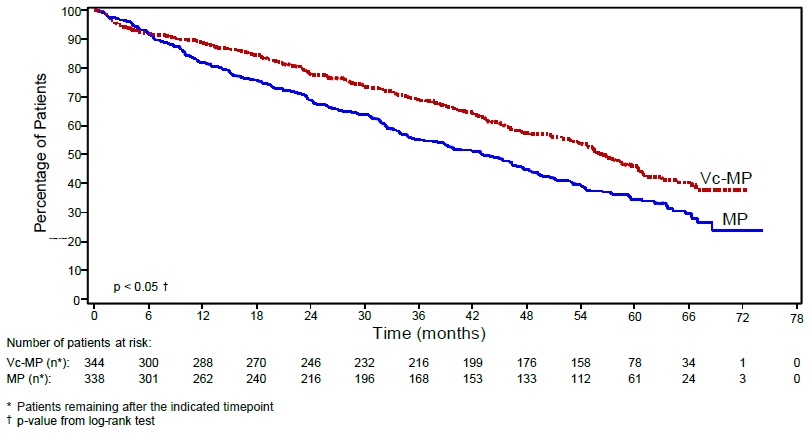
Figure 2: Overall Survival Bortezomib, Melphalan And Prednisone Vs Melphalan And Prednisone (Bortezomib Fig4)

Figure 2: Overall Survival Bortezomib, Melphalan And Prednisone Vs Melphalan And Prednisone (Bortezomib Fig4)
A line graph showing percentage of patients over time in months, comparing two groups labeled Vc-MP and MP. The graph includes data points from 0 to 72 months, with Vc-MP group indicated by a red dashed line maintaining higher patient percentages than the MP group, which is shown by a blue solid line. Below the graph is a table listing the number of patients at risk at various time points for both groups. A note indicates a p-value less than 0.05 from a log-rank test.*
FDA Label Image

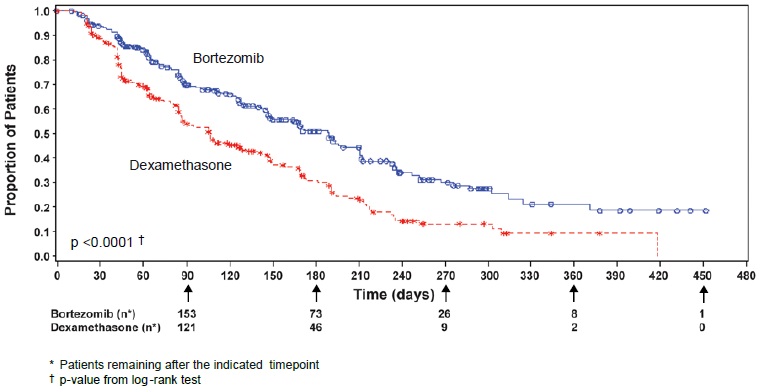
Figure 3: Time To Progression Bortezomib Vs Dexamethasone (relapsed Multiple Myeloma Study) (Bortezomib Fig5)

Figure 3: Time To Progression Bortezomib Vs Dexamethasone (relapsed Multiple Myeloma Study) (Bortezomib Fig5)
A survival curve chart comparing Bortezomib and Dexamethasone treatments. The vertical axis shows the proportion of patients, and the horizontal axis represents time in days. The chart includes patient counts at specific time points and a p-value from a log-rank test, illustrating the difference in outcomes between the two treatments over time.*
FDA Label Image

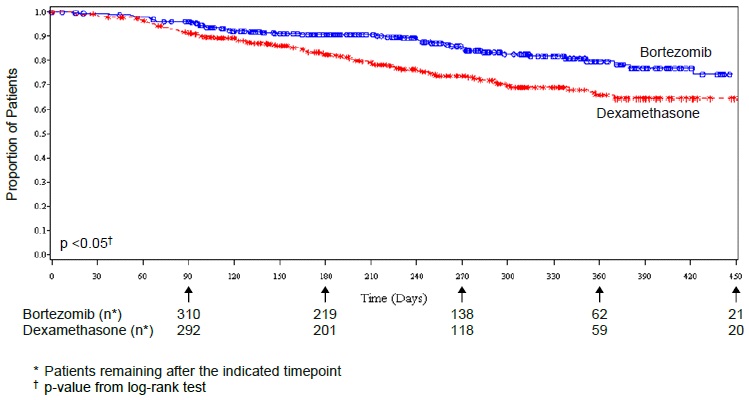
Figure 4: Overall Survival Bortezomib Vs Dexamethasone (relapsed Multiple Myeloma Study) (Bortezomib Fig6)

Figure 4: Overall Survival Bortezomib Vs Dexamethasone (relapsed Multiple Myeloma Study) (Bortezomib Fig6)
A Kaplan-Meier survival curve comparing the proportion of patients over time receiving Bortezomib versus Dexamethasone. The y-axis shows the proportion of patients, and the x-axis shows time in days, up to 450 days. Bortezomib's curve remains higher than Dexamethasone's, with patient counts at various timepoints noted below the x-axis. Statistical significance is indicated with a p-value less than 0.05 from a log-rank test.*
FDA Label Image

Bortezomib-fign7 (Bortezomib Fig7)

Bortezomib-fign7 (Bortezomib Fig7)
A Kaplan-Meier survival curve comparing patient survival percentages over time (in months) between two treatment groups: VcR-CAP and R-CHOP. The graph shows higher survival in the VcR-CAP group. The x-axis represents time in months, and the y-axis represents percentage of patients. The graph includes a log rank test p-value of less than 0.001 and a table of subjects at risk at various time points for both groups.*
FDA Label Image

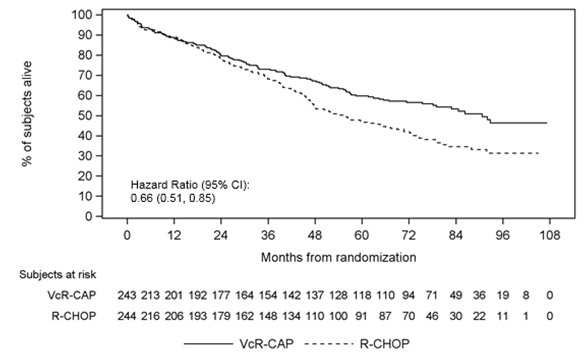
Bortezomib-fign8 (Bortezomib Fig8)

Bortezomib-fign8 (Bortezomib Fig8)
A Kaplan-Meier survival curve comparing the percentage of subjects alive over time in months from randomization between two treatment groups labeled VcR-CAP (solid line) and R-CHOP (dashed line). The graph includes a hazard ratio with 95% confidence interval (0.66, 0.51 to 0.85) and a table of subjects at risk at various time points for both groups.*
FDA Label Image

Package Label-principal Display Panel-3.5 mg Per Vial (Container Label)

Package Label-principal Display Panel-3.5 mg Per Vial (Container Label)
Bortezomib for Injection label showing 3.5 mg per vial strength. The lyophilized powder is for intravenous or subcutaneous use in a single-dose vial. Label includes storage instructions, manufacturer Eugia US LLC, and barcode. Marked Rx only.*
FDA Label Image

Chemical Structure (Bortezomib Str)

Chemical Structure (Bortezomib Str)
Chemical structure of bortezomib, showing its molecular framework including boron, nitrogen, oxygen, and carbon atoms arranged in a complex organic structure.*

* About these descriptions: Image descriptions on this page are generated by automated AI analysis of the product label images from the manufacturer's FDA label submission (SPL). They are provided for reference only and may contain errors or omissions. Always rely on the printed label itself and the official FDA labeling, and consult a pharmacist or healthcare professional with any questions about this product.