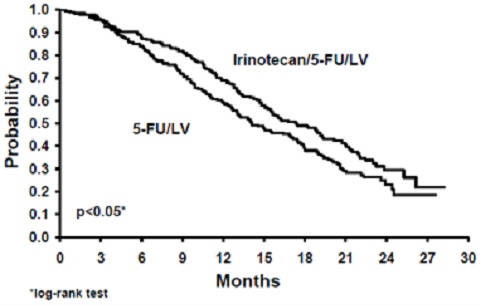
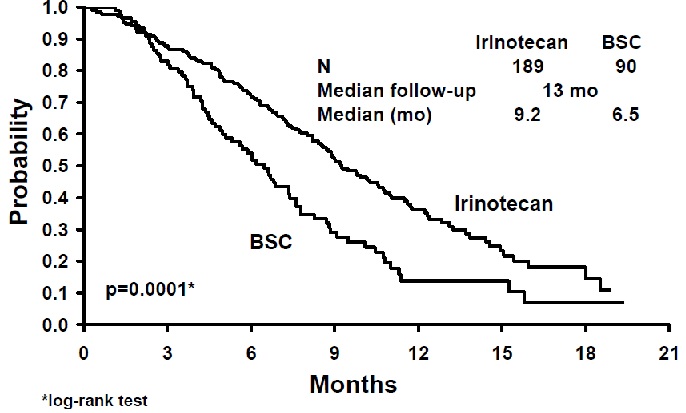
First-line Irinotecan/5-fu/lv Vs 5-fu/lv Study 1 (Irinotecan Fig1)
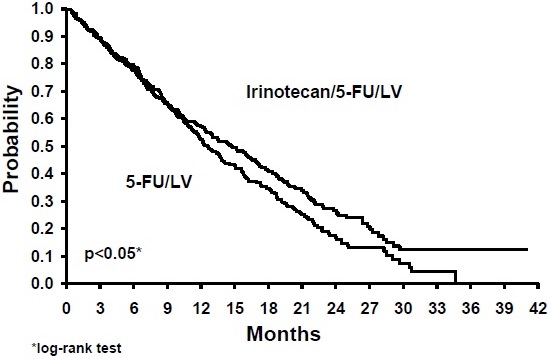
The text seems to be a chart or a graph that shows the performance of Irinotecan/5-FU/LV and 5-FU/LV over a period of 42 months. The horizontal axis shows the months, whereas the vertical axis probably corresponds to the effectiveness or the survival rate of each treatment. The notation "0.0 +— - - - ." may represent some measurement. The chart also refers to a log-rank test, probably used to compare the two treatments. Not enough information is available to make any definitive conclusion.*