Tirofiban-figure-1 (Tirofiban Fig1)
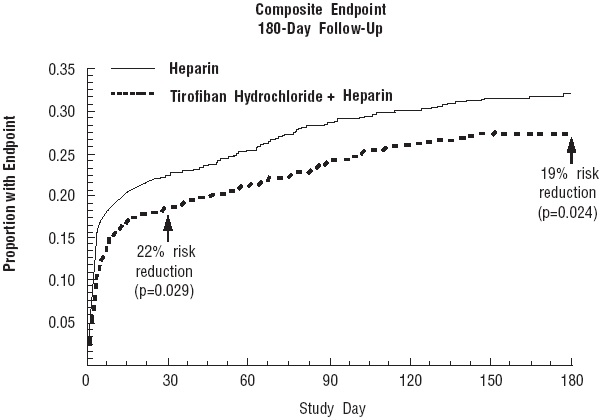
The text appears to be a graph with the title "Proportion with Endpoint Composite Endpoint 180-Day Follow-Up" showing data for two treatment options (Heparin and Tirofiban Hydrochloride + Heparin) over a period of 180 days. The graph shows risk reduction percentages for each treatment option at different time points. The was able to extract some numerical data along with p-value statistics.*