Dexrazoxane-fig1 (Dexrazoxane Fig1)
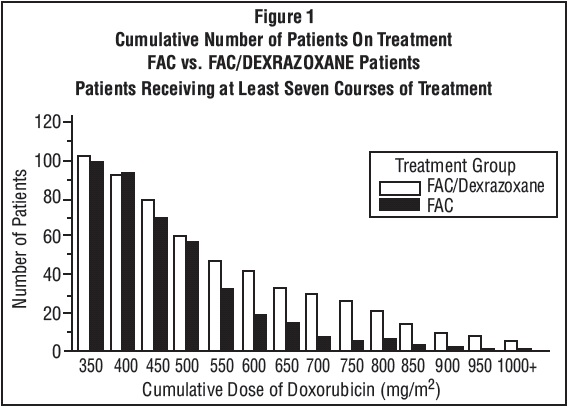
The text describes a figure (Figure 1) showing a comparison between patients treated with FAC and FAC/DEXRAZOXANE in terms of cumulative number of patients on treatment, with at least seven courses of treatment. The horizontal axis shows the cumulative dose of Doxorubicin (measured in mg/m?) and the vertical axis shows the treatment groups (FAC and FAC/DEXRAZOXANE) with a range from 0 to 120. The figure also includes a scatter plot with the number of patients at different cumulative doses of doxorubicin.*