Trintellix Tablet, Film Coated
Product Images NDC 55154-0257

View Photos of Packaging, Regulatory Labels, and Product Appearance

Product Visual Gallery

This gallery contains 12 technical images submitted to the FDA as part of the official labeling for Trintellix (NDC 55154-0257). Unlike standard consumer photos, these assets often include clinical data figures, molecular chemical structures, and official manufacturer packaging layouts.

As provided by Cardinal Health 107, Llc, these visuals offer a comprehensive scientific overview of the product's physical and chemical identity, aiding pharmacists and researchers in product verification and study.

FDA Label Image

86c93382 D2e2 452e B198 3ed638f5faa0 00
86c93382 D2e2 452e B198 3ed638f5faa0 00
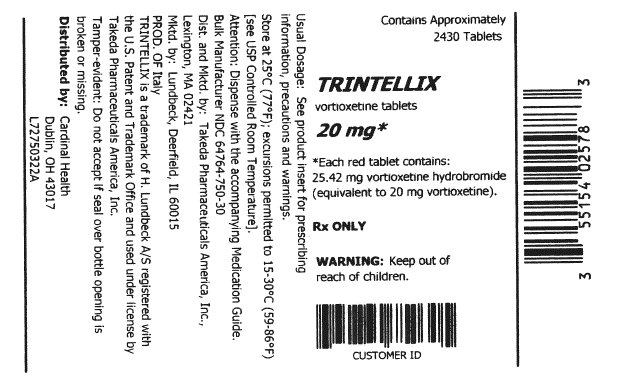
Trintellix 20 mg vortioxetine tablets packaging label showing product name, strength, and dosage form as oral film-coated tablets. The label lists active ingredient content per tablet, storage instructions, distributor information as Cardinal Health 107, LLC, and barcode details. It includes a warning to keep out of reach of children and mentions Rx only status.*
FDA Label Image

86c93382 D2e2 452e B198 3ed638f5faa0 01

86c93382 D2e2 452e B198 3ed638f5faa0 01
Label for Trintellix 10 mg vortioxetine tablets, distributed by Cardinal Health 107, LLC. The label lists the approximate count as 2520 tablets and includes a warning to keep out of reach of children. It specifies that each yellow tablet contains 12.71 mg vortioxetine hydrobromide, equivalent to 10 mg vortioxetine. Additional storage and handling information is also visible.*
FDA Label Image

Figure 1 (Trintellix 01)

Figure 1 (Trintellix 01)
Chemical structure diagram depicting vortioxetine hydrobromide, the active ingredient in Trintellix. The diagram shows the arrangement of atoms and bonds characteristic of vortioxetine's molecular formula.*
FDA Label Image

Figure 2 (Trintellix 02)

Figure 2 (Trintellix 02)
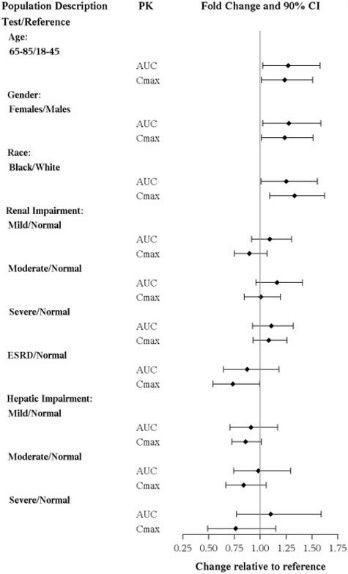
A forest plot chart showing fold change and 90% confidence intervals for pharmacokinetic parameters AUC and Cmax across various population subgroups including age, gender, race, renal impairment, ESRD, and hepatic impairment compared to reference groups.*
FDA Label Image

Figure 3 (Trintellix 03)

Figure 3 (Trintellix 03)
A forest plot showing the fold change and 90% confidence interval of pharmacokinetic parameters (AUC and Cmax) for vortioxetine when coadministered with various interacting drugs, including CYP2D6 inhibitor bupropion, CYP inducer rifampin, CYP3A/Pgp inhibitor ketoconazole, CYP2C9/2C19/3A inhibitor fluconazole, CYP2C19 inhibitor omeprazole, ethanol, and aspirin. The x-axis shows the change relative to vortioxetine alone.*
FDA Label Image

Chemical Structure (Trintellix 04)

Chemical Structure (Trintellix 04)
A fold change and 90% confidence interval chart showing pharmacokinetic interactions of various substrates with Trintellix (vortioxetine). The chart compares AUC and Cmax values for CYP2B6, CYP2C9, CYP2C19, and CYP3A substrates, as well as other drugs like warfarin, aspirin, ethanol, and lithium, relative to the interacting drug alone.*
FDA Label Image

Figure 4 (Trintellix 05)

Figure 4 (Trintellix 05)
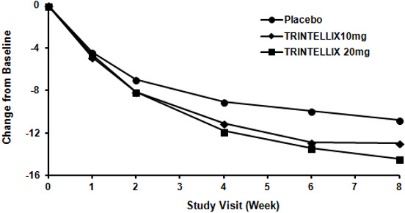
A line graph depicting change from baseline over an 8-week study period for placebo and Trintellix (vortioxetine) 10 mg and 20 mg doses. The y-axis shows change from baseline, while the x-axis indicates study visits in weeks, comparing efficacy over time among the three groups.*
FDA Label Image

Figure 5 (Trintellix 06)

Figure 5 (Trintellix 06)
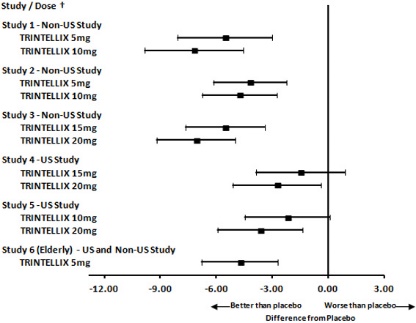
A forest plot chart showing the difference from placebo in effectiveness for various doses of Trintellix (vortioxetine) across six studies, including US, non-US, and elderly populations. The horizontal axis measures the difference from placebo, ranging from -12 to +3, with negative values indicating better outcomes than placebo. Each study lists doses tested, with data points and confidence intervals represented by squares and horizontal lines.*
FDA Label Image

Figure 6 (Trintellix 07)

Figure 6 (Trintellix 07)
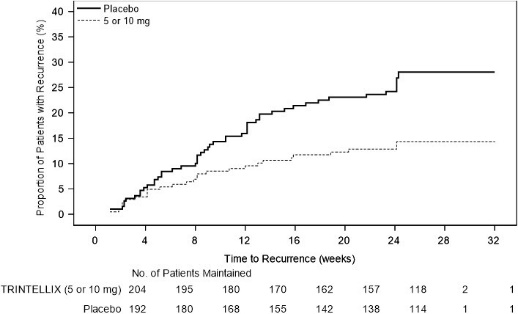
A Kaplan-Meier curve graph showing the proportion of patients with recurrence over time in weeks. Two lines compare placebo and Trintellix (5 or 10 mg) groups up to 32 weeks, illustrating recurrence rates. The number of patients maintained in each group decreases over time, noted below the x-axis.*
FDA Label Image

Figure 7 (Trintellix 08)

Figure 7 (Trintellix 08)
A line graph depicting the proportion of patients with recurrence (%) over time in weeks (up to 32 weeks) for Trintellix tablets at 5 mg, 10 mg, and 20 mg doses compared to placebo. A table below the graph shows the number of patients maintained for each treatment group at various time points.*
FDA Label Image

Figure 8 (Trintellix 09)

Figure 8 (Trintellix 09)
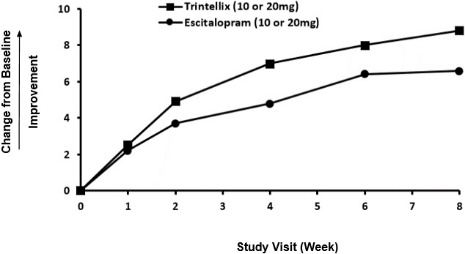
A line graph comparing improvement from baseline over an 8-week study period for Trintellix (10 or 20 mg) and Escitalopram (10 or 20 mg). The y-axis represents change from baseline improvement, and the x-axis shows study visits by week. Trintellix shows greater improvement than Escitalopram across the study duration.*
FDA Label Image

Trintellix 10

Trintellix 10
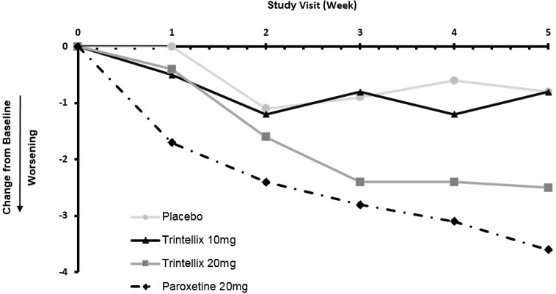
Line graph depicting change from baseline in a study over five weeks, comparing Placebo, Trintellix 10 mg, Trintellix 20 mg, and Paroxetine 20 mg. The vertical axis represents change from baseline indicating worsening, and the horizontal axis shows the study visit weeks from 0 to 5.*

* About these descriptions: Image descriptions on this page are generated by automated AI analysis of the product label images from the manufacturer's FDA label submission (SPL). They are provided for reference only and may contain errors or omissions. Always rely on the printed label itself and the official FDA labeling, and consult a pharmacist or healthcare professional with any questions about this product.