Jardiance Tablet, Film Coated
Product Images NDC 55154-0411

13 FDA label images from Cardinal Health 107, Llc · Packaging, Regulatory Labels, and Product Appearance

Product Visual Gallery

This gallery contains 13 technical images submitted to the FDA as part of the official labeling for Jardiance (NDC 55154-0411). Unlike standard consumer photos, these assets often include clinical data figures, molecular chemical structures, and official manufacturer packaging layouts.

As provided by Cardinal Health 107, Llc, these visuals offer a comprehensive scientific overview of the product's physical and chemical identity, aiding pharmacists and researchers in product verification and study.

FDA Label Image

27634b0e A748 4bc1 84c7 E29c6af1d790 00

27634b0e A748 4bc1 84c7 E29c6af1d790 00
Jardiance 25 mg tablets packaging label showing the brand and generic name Empagliflozin. The label indicates that the package contains approximately 990 tablets with a prescription-only warning and storage instructions. The labeler is Cardinal Health 107, LLC with distribution in Indianapolis, IN.*
FDA Label Image

27634b0e A748 4bc1 84c7 E29c6af1d790 01

27634b0e A748 4bc1 84c7 E29c6af1d790 01
Label for Jardiance 10 mg film-coated tablets containing empagliflozin. The label warns it is Rx only and to keep out of reach of children. It states the bottle contains approximately 720 tablets. Storage instructions and distributor/manufacturer information are included, with Cardinal Health and Eli Lilly USA listed.*
FDA Label Image

Jardiance 01

Jardiance 01
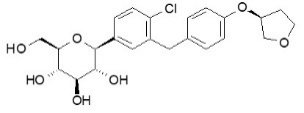
Chemical structure of Empagliflozin, the active ingredient in Jardiance. The diagram shows the molecular arrangement including several hydroxyl groups, aromatic rings, a chlorine atom, and an ether linkage consistent with the known structure of Empagliflozin.*
FDA Label Image

Jardiance 02

Jardiance 02
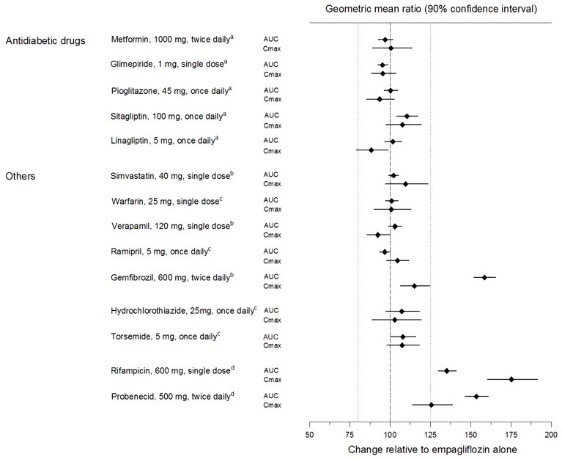
A chart showing the geometric mean ratio with 90% confidence intervals for the change in AUC and Cmax relative to empagliflozin alone. The chart compares multiple drugs including antidiabetic drugs such as Metformin, Glimepiride, Pioglitazone, Sitagliptin, Linagliptin, and others like Simvastatin, Warfarin, Verapamil, Ramipril, Gemfibrozil, Hydrochlorothiazide, Torsemide, Rifampicin, and Probenecid on the left with corresponding values plotted to the right.*
FDA Label Image

Jardiance 03

Jardiance 03
A forest plot chart showing geometric mean ratios with 90% confidence intervals for various drugs including antidiabetic drugs, oral contraceptives, and others. Drug names, doses, and administration frequencies are listed on the left, with corresponding AUC and Cmax values plotted to the right to indicate relative exposure and peak concentration comparisons.*
FDA Label Image

Jardiance 04

Jardiance 04
A line graph depicting the mean change from baseline in HbA1c percentage over 24 weeks for three groups: placebo, Empagliflozin 10 mg, and Empagliflozin 25 mg. The x-axis represents time in weeks, and the y-axis shows HbA1c percentage change. Empagliflozin groups show greater reduction compared to placebo, with error bars indicating variability.*
FDA Label Image

Jardiance 05

Jardiance 05
A line graph comparing mean change from baseline in HbA1c (%) over 52 weeks for two treatments: Glimepiride + Metformin and Empagliflozin 25 mg + Metformin. The x-axis represents time in weeks, and the y-axis shows percentage change in HbA1c from baseline. Data points highlight trends with both treatments reducing HbA1c, showing differences in effectiveness over time.*
FDA Label Image

Jardiance 06

Jardiance 06
A line graph comparing the percentage of patients with events over 48 months between placebo and empagliflozin treatment groups. The y-axis shows patients with events (%) and the x-axis represents time in months. The placebo group has a higher event rate compared to the empagliflozin group throughout the study period.*
FDA Label Image

Jardiance 07

Jardiance 07
A line graph comparing the percentage of patients with events over 48 months between placebo and all empagliflozin groups. The x-axis represents time in months, and the y-axis shows the percentage of patients with the event. A table below the graph lists the number of subjects at risk at various time points for each group.*
FDA Label Image

Jardiance 08

FDA Label Image

Jardiance 08a

Jardiance 08a
A line chart comparing the estimated cumulative incidence function percentages over time between placebo and Empagliflozin 10 mg groups in a clinical study. The x-axis shows days since randomization, and the y-axis shows cumulative incidence percentage. The graph includes hazard ratio, confidence interval, and p-value statistics comparing Empagliflozin 10 mg to placebo.*
FDA Label Image

Jardiance 08b

Jardiance 08b
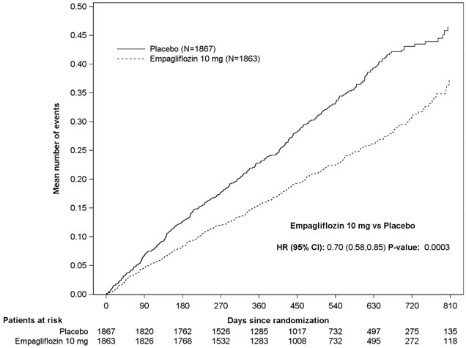
A line graph comparing the mean number of events over days since randomization for placebo and Empagliflozin 10 mg groups. The graph shows two curves, one solid for placebo and one dotted for Empagliflozin 10 mg, illustrating their respective event rates over time up to 810 days. The hazard ratio and p-value for Empagliflozin 10 mg versus placebo are also displayed.*
FDA Label Image

Jardiance 08c

Jardiance 08c
A forest plot illustrating hazard ratios comparing Empagliflozin 10 mg versus placebo across various patient subgroups, including diabetes status, age, sex, race, BMI, eGFR levels, NYHA class, heart failure physiology, and medication use. The plot shows point estimates with 95% confidence intervals, indicating relative effects and statistical significance in several subgroups.*

* About these descriptions: Image descriptions on this page are generated by automated AI analysis of the product label images from the manufacturer's FDA label submission (SPL). They are provided for reference only and may contain errors or omissions. Always rely on the printed label itself and the official FDA labeling, and consult a pharmacist or healthcare professional with any questions about this product.