Invokana Tablet, Film Coated
Product Images NDC 55154-1425

7 FDA label images from Cardinal Health 107, Llc · Packaging, Regulatory Labels, and Product Appearance

Product Visual Gallery

This gallery contains 7 technical images submitted to the FDA as part of the official labeling for Invokana (NDC 55154-1425). Unlike standard consumer photos, these assets often include clinical data figures, molecular chemical structures, and official manufacturer packaging layouts.

As provided by Cardinal Health 107, Llc, these visuals offer a comprehensive scientific overview of the product's physical and chemical identity, aiding pharmacists and researchers in product verification and study.

FDA Label Image

8a50dce1 18d8 4827 A596 9214a91fd08b 00
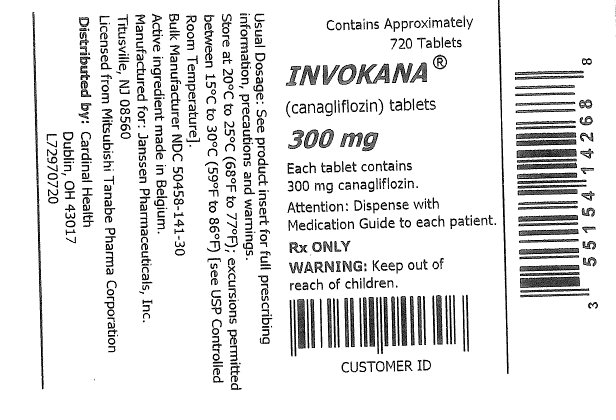
8a50dce1 18d8 4827 A596 9214a91fd08b 00
Label for INVOKANA 300 mg (canagliflozin) tablets containing approximately 720 tablets. The film-coated oral tablets each contain 300 mg of canagliflozin. Label includes handling warnings, storage instructions, and dispensing information. Manufactured by Janssen Pharmaceuticals and distributed by Cardinal Health 107, LLC.*
FDA Label Image

8a50dce1 18d8 4827 A596 9214a91fd08b 01

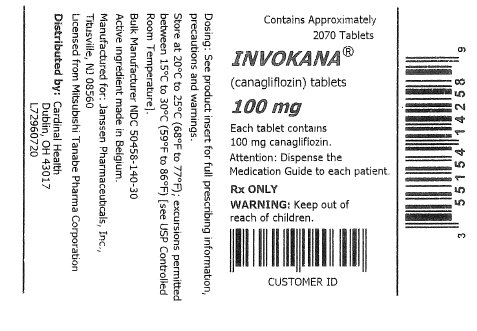
8a50dce1 18d8 4827 A596 9214a91fd08b 01
Label for INVOKANA 100 mg tablets, containing approximately 2070 oral film-coated tablets. Each tablet contains 100 mg of canagliflozin. The label includes storage instructions, manufacturer and distributor information, warnings to keep out of reach of children, and barcodes.*
FDA Label Image

Invokana 01

Invokana 01
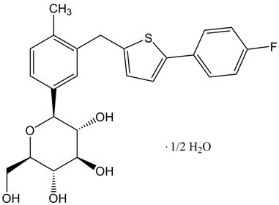
Chemical structure of canagliflozin, showing its molecular arrangement including aromatic rings, hydroxyl groups, sulfur atom, and fluorine substitution, along with a 1/2 H2O hydrate notation.*
FDA Label Image

Invokana 02

Invokana 02
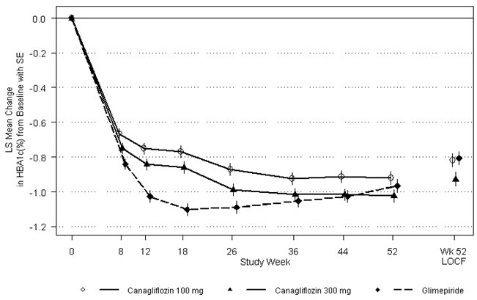
A line graph showing the least squares mean change in HbA1c percentage from baseline over a 52-week study period. The x-axis represents study weeks, and the y-axis indicates change in HbA1c, with data presented for Canagliflozin 100 mg, Canagliflozin 300 mg, and Glimepiride treatment groups.*
FDA Label Image

Invokana 03

Invokana 03
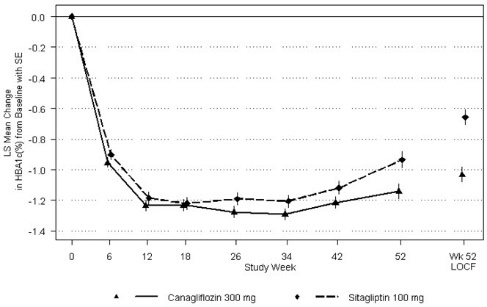
A line graph comparing changes in HbA1c levels from baseline over 52 weeks between Canagliflozin 300 mg and Sitagliptin 100 mg. The x-axis represents study weeks, and the y-axis shows LS mean change in HbA1c percentage with standard error. Data points illustrate trends across the study duration for each treatment group.*
FDA Label Image

Invokana 04

Invokana 04
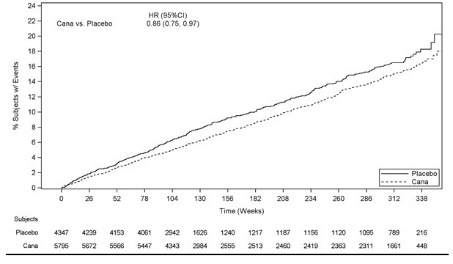
A line graph comparing the percentage of subjects with events over time (weeks) between canagliflozin (Cana) and placebo groups. The y-axis represents the percentage of subjects with events, ranging from 0% to 24%, and the x-axis shows time in weeks from 0 to 338. Two lines display event rates for placebo and canagliflozin, with accompanying numbers of subjects at various time points.*
FDA Label Image

Invokana 05

Invokana 05
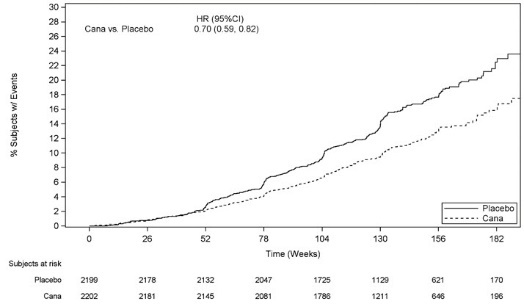
A line graph comparing the percentage of subjects with events over time in weeks for canagliflozin (Cana) versus placebo. The graph includes a legend differentiating the Cana and placebo groups and shows hazard ratio with confidence intervals. A table below shows the number of subjects at risk in each group across different time points.*

* About these descriptions: Image descriptions on this page are generated by automated AI analysis of the product label images from the manufacturer's FDA label submission (SPL). They are provided for reference only and may contain errors or omissions. Always rely on the printed label itself and the official FDA labeling, and consult a pharmacist or healthcare professional with any questions about this product.