Oxcarbazepine Tablet, Film Coated
Product Images NDC 55154-2139

View Photos of Packaging, Regulatory Labels, and Product Appearance

Product Visual Gallery

This gallery contains 7 technical images submitted to the FDA as part of the official labeling for Oxcarbazepine (NDC 55154-2139). Unlike standard consumer photos, these assets often include clinical data figures, molecular chemical structures, and official manufacturer packaging layouts.

As provided by Cardinal Health 107, Llc, these visuals offer a comprehensive scientific overview of the product's physical and chemical identity, aiding pharmacists and researchers in product verification and study.

FDA Label Image

Ahp72201

Ahp72201
Oxcarbazepine 150 mg film-coated oral tablets shown from two angles. Each oval, light brown tablet is marked with a scored line and imprinted with the letter 'A' on one side and the numbers '77' on the other. Manufactured by Cardinal Health 107, LLC.*
FDA Label Image

Figure 1: Kaplan-meier Estimates Of Exit Rate By Treatment Group (Figure1)

Figure 1: Kaplan-meier Estimates Of Exit Rate By Treatment Group (Figure1)
A Kaplan-Meier survival curve chart comparing exit rates over time between Oxcarbazepine and placebo treatment groups. The x-axis shows time on trial from Day 2 to Day 11 in days, and the y-axis indicates the exit rate from 0 to 1. The chart includes a log-rank test p-value of 0.0001.*
FDA Label Image

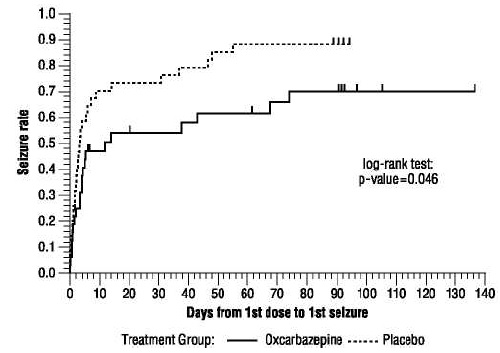
Figure 2: Kaplan-meier Estimates Of First Seizure Event Rate By Treatment Group (Figure2)

Figure 2: Kaplan-meier Estimates Of First Seizure Event Rate By Treatment Group (Figure2)
A Kaplan-Meier curve graph showing seizure rate over time (days from first dose to first seizure) for two treatment groups: Oxcarbazepine and Placebo. The solid line represents Oxcarbazepine with a lower seizure rate over time, while the dashed line represents Placebo with a higher seizure rate. The graph includes a log-rank test with p-value=0.046, indicating statistical comparison between groups.*
FDA Label Image

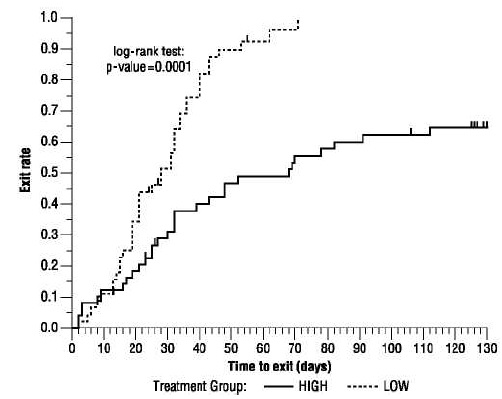
Figure 3: Kaplan-meier Estimates Of Exit Rate By Treatment Group (Figure3)

Figure 3: Kaplan-meier Estimates Of Exit Rate By Treatment Group (Figure3)
A Kaplan-Meier survival curve chart illustrating the exit rate over time (days) for two treatment groups labeled HIGH (solid line) and LOW (dotted line). The vertical axis represents exit rate from 0.0 to 1.0, and the horizontal axis represents time to exit in days from 0 to 130. A log-rank test p-value of 0.0001 is indicated on the chart.*
FDA Label Image

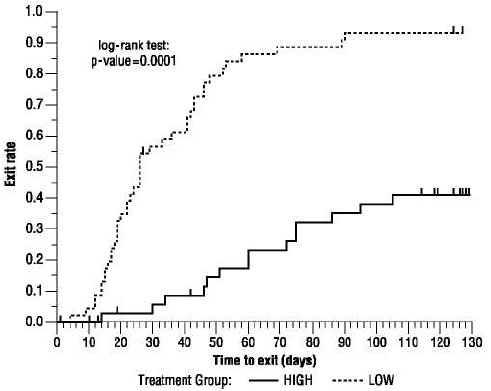
Figure 4: Kaplan-meier Estimates Of Exit Rate By Treatment Group (Figure4)

Figure 4: Kaplan-meier Estimates Of Exit Rate By Treatment Group (Figure4)
A Kaplan-Meier survival curve chart showing exit rates over time (in days) for two treatment groups labeled HIGH (solid line) and LOW (dashed line). The y-axis represents the exit rate ranging from 0 to 1, and the x-axis represents time to exit in days up to 130. A log-rank test p-value of 0.0001 is indicated on the chart.*
FDA Label Image

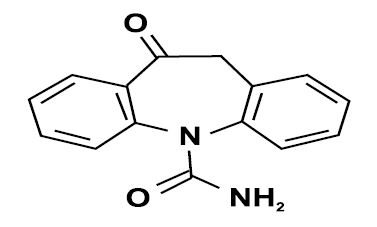
Structural Formula (Structure)

Structural Formula (Structure)
Chemical structure diagram of oxcarbazepine, an anticonvulsant medication. The structure depicts a dibenzazepine core with keto and amide functional groups as part of the molecule.*
FDA Label Image

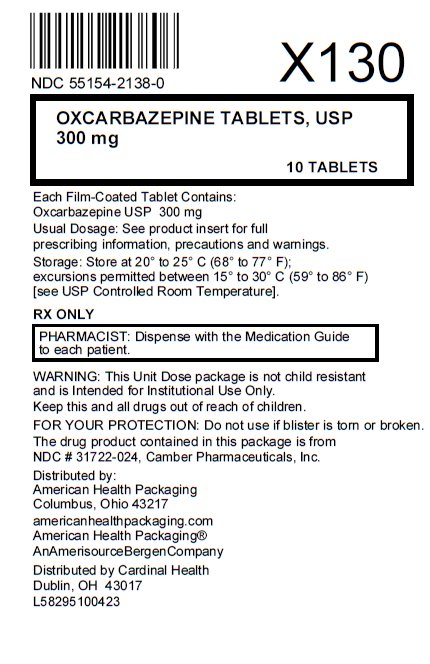
Bag Label (Image 01)

Bag Label (Image 01)
Oxcarbazepine Tablets, USP 300 mg film-coated tablets in a unit dose package containing 10 tablets. The label includes storage instructions, dispensing directions, warnings, and distributor information for Cardinal Health 107, LLC and American Health Packaging.*

* About these descriptions: Image descriptions on this page are generated by automated AI analysis of the product label images from the manufacturer's FDA label submission (SPL). They are provided for reference only and may contain errors or omissions. Always rely on the printed label itself and the official FDA labeling, and consult a pharmacist or healthcare professional with any questions about this product.