Tamsulosin Hydrochloride Capsule
Product Images NDC 55154-2142

View Photos of Packaging, Regulatory Labels, and Product Appearance

Product Visual Gallery

This gallery contains 7 technical images submitted to the FDA as part of the official labeling for Tamsulosin Hydrochloride (NDC 55154-2142). Unlike standard consumer photos, these assets often include clinical data figures, molecular chemical structures, and official manufacturer packaging layouts.

As provided by Cardinal Health 107, Llc, these visuals offer a comprehensive scientific overview of the product's physical and chemical identity, aiding pharmacists and researchers in product verification and study.

FDA Label Image

0.4mg Bag Label (262d5283 99e2 6377 E063 6394a90a60b5 00)

0.4mg Bag Label (262d5283 99e2 6377 E063 6394a90a60b5 00)
Label for Tamsulosin Hydrochloride capsules, USP 0.4 mg, containing 10 capsules. The label indicates the product is for oral use and prescription only, distributed by Cardinal Health 107, LLC. Storage instructions and warnings about child resistance and institutional use are included.*
FDA Label Image

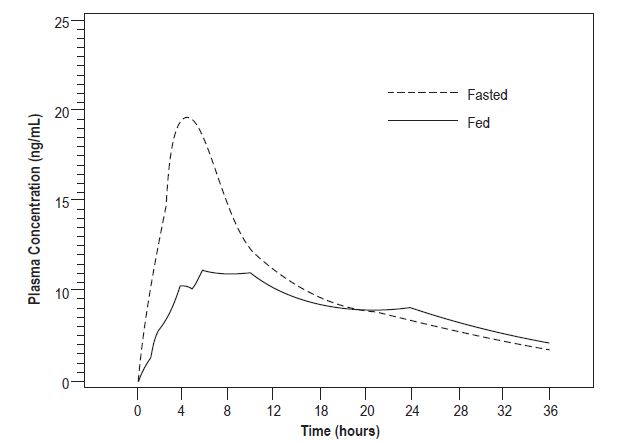
Figure 1 (Figure 1)

Figure 1 (Figure 1)
A pharmacokinetic line graph showing plasma concentration (ng/mL) of Tamsulosin Hydrochloride over time (hours) for fasting and fed states. The graph compares drug concentration profiles between fasted (dashed line) and fed (solid line) conditions over a 36-hour period.*
FDA Label Image

Figure 2a (Figure 2a)

Figure 2a (Figure 2a)
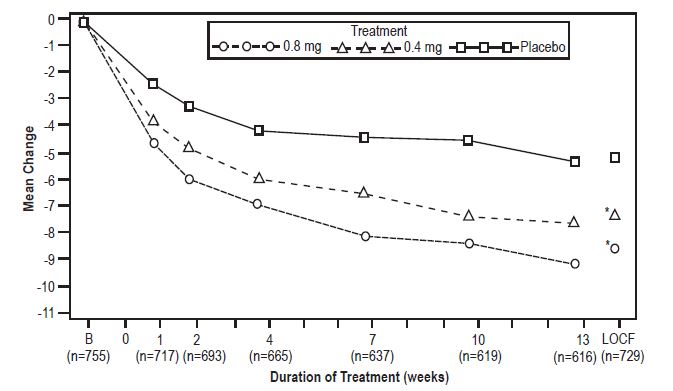
A line graph depicting treatment efficacy over a 13-week period with mean change on the vertical axis and duration of treatment in weeks on the horizontal axis. It compares three groups: 0.8 mg, 0.4 mg, and placebo, showing trends of change for each treatment group throughout the study timeline.*
FDA Label Image

Figure 2b (Figure 2b)

Figure 2b (Figure 2b)
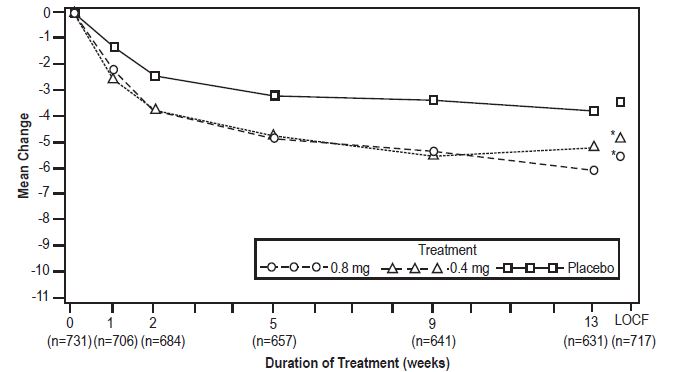
A line graph showing mean change over time during treatment with Tamsulosin Hydrochloride and placebo. The x-axis represents the duration of treatment in weeks, and the y-axis shows the mean change. Three groups are compared: 0.8 mg dose, 0.4 mg dose, and placebo, with data points extending to 13 weeks and LOCF (Last Observation Carried Forward). Sample sizes are indicated below the x-axis for each time point.*
FDA Label Image

Figure 3a (Figure 3a)

Figure 3a (Figure 3a)
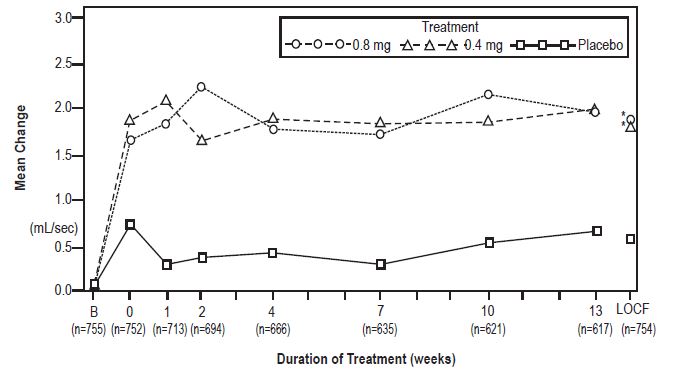
A line graph showing the mean change in mL/sec over weeks of treatment comparing Tamsulosin Hydrochloride 0.8 mg, 0.4 mg, and placebo. The x-axis represents the duration of treatment in weeks from baseline to last observation carried forward (LOCF). The y-axis shows the mean change in mL/sec. Both dosages of Tamsulosin show higher mean changes compared to placebo throughout the treatment period.*
FDA Label Image

Figure 3b (Figure 3b)

Figure 3b (Figure 3b)
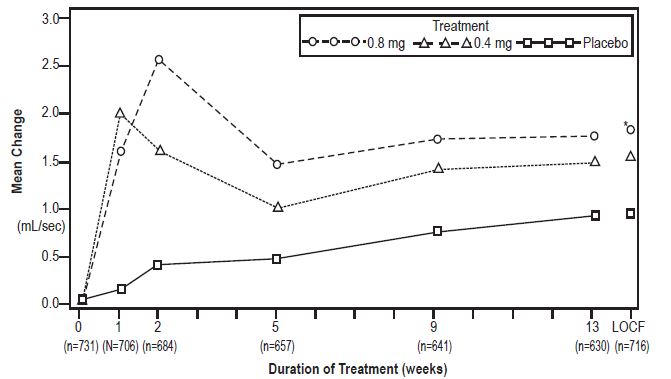
A line graph showing mean change in flow rate (mL/sec) over duration of treatment in weeks for three groups: 0.8 mg, 0.4 mg Tamsulosin Hydrochloride, and placebo. The graph compares treatment effects over 0, 1, 2, 5, 9, and 13 weeks, including last observation carried forward (LOCF) data points, with sample sizes indicated for each time point.*
FDA Label Image

Structural Formula (Structure)

Structural Formula (Structure)
Chemical structure of Tamsulosin Hydrochloride showing its molecular arrangement including aromatic rings and functional groups.*

* About these descriptions: Image descriptions on this page are generated by automated AI analysis of the product label images from the manufacturer's FDA label submission (SPL). They are provided for reference only and may contain errors or omissions. Always rely on the printed label itself and the official FDA labeling, and consult a pharmacist or healthcare professional with any questions about this product.