Product Images Duloxetine

View Photos of Packaging, Labels & Appearance

Product Label Images

The following 12 images provide visual information about the product associated with Duloxetine NDC 55154-2342 by Cardinal Health 107, Llc, such as packaging, labeling, and the appearance of the drug itself. This resource could be helpful for medical professionals, pharmacists, and patients seeking to verify medication information and ensure they have the correct product.

bag label - 26E7C5D9 F191 43D5 81C8 E6CF1FCB3986 00

bag label - 26E7C5D9 F191 43D5 81C8 E6CF1FCB3986 00

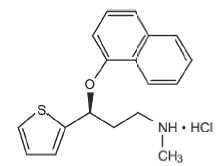
This is a medication package for Duloxetine Delayed-Release Capsules USP. Each capsule contains 60mg of duloxetine hydrochloride USP. The product insert provides dosage, prescribing information, and precautions. The medication should be stored at 20° to 25°C (68° to 77°F), with excursions permitted to 15° to 30°C (59° to 88°F). The package is not child-resistant and is intended for institutional use only. It should be kept away from the reach of children and dispensed in a tightly closed container. The medication is distributed by Rising Health, LLC from Saddle Brook, NJ, 07653, and made in India. It is also distributed by Major Pharmaceuticals and Cardinal Health in the USA.*

bag label - 26E7C5D9 F191 43D5 81C8 E6CF1FCB3986 01

bag label - 26E7C5D9 F191 43D5 81C8 E6CF1FCB3986 01

Figure 1: Kaplan-Meier Estimation of Cumulative Proportion of Patients with Relapse (MDD Study 5) - duloxetine fig1

Figure 1: Kaplan-Meier Estimation of Cumulative Proportion of Patients with Relapse (MDD Study 5) - duloxetine fig1

Figure-2 - duloxetine fig2

Figure-2 - duloxetine fig2

Figure-3 - duloxetine fig3

Figure-3 - duloxetine fig3

Figure 4: Percentage of DPNP Adult Patients Achieving Various Levels of Pain Relief as Measured by 24-Hour Average Pain Severity (Study DPNP-2) - duloxetine fig4

Figure 4: Percentage of DPNP Adult Patients Achieving Various Levels of Pain Relief as Measured by 24-Hour Average Pain Severity (Study DPNP-2) - duloxetine fig4

The text represents a graph showing the percentage of patients who improved in pain from baseline after being treated with either Duloxetine 60 mg BID (twice a day), Duloxetine 60 mg QD (once a day), or placebo. The horizontal axis shows the percent improvement in pain from baseline, and the vertical axis shows the percentage of patients improved. The data points on the graph show the percentage of patients who improved after treatment.*

Figure 5 - duloxetine fig5

Figure 5 - duloxetine fig5

The text describes a chart showing the percentage of patient improvement in pain based on different levels of improvement (10%, 20%, 30%, etc.). The chart also includes data points for the percent improvement in pain from baseline at 290 points, and different treatment options including Duloxetine 60 mg taken once or twice a day, and a placebo.*

Figure 6 - duloxetine fig6

Figure 6 - duloxetine fig6

This is a graph showing the percent of patients who experienced pain improvement from baseline when taking duloxetine at different doses compared to placebo. The doses tested were 20mg, 60mg, and 120mg taken once daily. The X-axis represents the level of improvement (ranging from 0% to 100%), and the Y-axis shows the percentage of patients who experienced that level of improvement.*

Figure 7 - duloxetine fig7

Figure 7 - duloxetine fig7

The text represents a chart showing the percentage of patients improved in a clinical trial of a drug called Duloxetine. The chart indicates that 100% of the patients who were given the drug experienced improvement, compared to 0% of the patients given a placebo. The X represents the placebo group, while the symbol # represents the Duloxetine group. The chart also provides data on the percentage of improvement in pain from baseline (BOCF) for the Duloxetine group. However, specific values for these percentages are not given.*

Figure 8 - duloxetine fig8

Figure 8 - duloxetine fig8

Figure 10: Percentage of Adult Patients with OA Achieving Various Levels of Pain Relief as Measured by 24-Hour Average Pain Severity (Study OA-1) - duloxetine fig9

Figure 10: Percentage of Adult Patients with OA Achieving Various Levels of Pain Relief as Measured by 24-Hour Average Pain Severity (Study OA-1) - duloxetine fig9

This is a graph displaying the percentage of improvement in pain from baseline (BOCF) on the x-axis and the number of patients on the y-axis. The graph shows the percentage of patients who received Placeto and Dulowetine 60/120 mg once daily and experienced pain relief. The numbers range from 0 to 100, with the highest number of patients experiencing a 60% improvement in pain.*

Chemical Structure - duloxetine str

Chemical Structure - duloxetine str

* The product label images have been analyzed using a combination of traditional computing and machine learning techniques. It should be noted that the descriptions provided may not be entirely accurate as they are experimental in nature. Use the information in this page at your own discretion and risk.