Tamsulosin Hydrochloride Capsule
Product Images NDC 55154-2636

View Photos of Packaging, Regulatory Labels, and Product Appearance

Product Visual Gallery

This gallery contains 7 technical images submitted to the FDA as part of the official labeling for Tamsulosin Hydrochloride (NDC 55154-2636). Unlike standard consumer photos, these assets often include clinical data figures, molecular chemical structures, and official manufacturer packaging layouts.

As provided by Cardinal Health 107, Llc, these visuals offer a comprehensive scientific overview of the product's physical and chemical identity, aiding pharmacists and researchers in product verification and study.

FDA Label Image

0.4mg Bag Label (0e3206ba Db3e 40b3 B46b C7ae4703fdea 00)

0.4mg Bag Label (0e3206ba Db3e 40b3 B46b C7ae4703fdea 00)
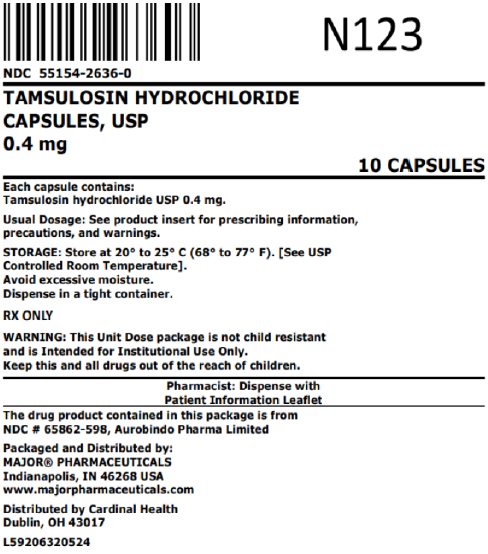
This is a description of Tamsulosin Hydrochloride 0.4mg capsules. Each package contains 10 capsules. The usual dosage instructions should be consulted in the product insert. The medication should be stored at 20° to 25° C and protected from excessive moisture. It is important to keep this medication out of reach of children as the packaging is not child-resistant. The drug is manufactured by Aurobindo Pharma Limited and distributed by Major Pharmaceuticals in the USA. For further information, consult with a pharmacist and refer to the patient information leaflet.*
FDA Label Image

Figure 1 Mean Plasma Tamsulosin Hydrochloride Concentrations Following Single-dose Administration Of Tamsulosin Hydrochloride Capsules 0.4 mg Under Fasted And Fed Conditions (n=8) (Tamsulosin Fig1)

Figure 1 Mean Plasma Tamsulosin Hydrochloride Concentrations Following Single-dose Administration Of Tamsulosin Hydrochloride Capsules 0.4 mg Under Fasted And Fed Conditions (n=8) (Tamsulosin Fig1)
This text provides information about the mean plasma concentrations of Tamsulosin Hydrochloride following the administration of 0.4 mg capsules under fasted and fed conditions. The figure shows a comparison of the concentration levels over time.*
FDA Label Image

Figure 2a Mean Change From Baseline In Total Aua Symptom Score (0 To 35) Study 1 (Tamsulosin Fig2)

Figure 2a Mean Change From Baseline In Total Aua Symptom Score (0 To 35) Study 1 (Tamsulosin Fig2)
This is not readable.*
FDA Label Image

Figure 2b Mean Change From Baseline In Total Aua Symptom Score (0 To 35) Study 2 (Tamsulosin Fig3)

Figure 2b Mean Change From Baseline In Total Aua Symptom Score (0 To 35) Study 2 (Tamsulosin Fig3)
This text provides a comparison of the mean change from baseline in the Total AUA Symptom Score for different treatments (0.08mg LNt, 0.4mg, Placebo) over a duration of treatment in weeks (0, 1, 2, 5, 9, 13, Last Observation Carried Forward - LOCF). It appears to be from Study 2, but specific details about the results or outcomes are not available.*
FDA Label Image

Figure 3a Mean Increase In Peak Urine Flow Rate (ml/sec) Study 1 (Tamsulosin Fig4)

Figure 3a Mean Increase In Peak Urine Flow Rate (ml/sec) Study 1 (Tamsulosin Fig4)
Figure 3A shows the mean increase in Peak Urine Flow Rate in L/Sec for Study 1. The graph displays the comparisons between different treatments (25mg, 0.08mg, 2x0.4mg, Placebo) over a range of duration of treatment in weeks. Each treatment group is represented with the mean change in mL/sec and the sample sizes are provided for each group.*
FDA Label Image

Figure 3b Mean Increase In Peak Urine Flow Rate (ml/sec) Study 2 (Tamsulosin Fig5)

Figure 3b Mean Increase In Peak Urine Flow Rate (ml/sec) Study 2 (Tamsulosin Fig5)
This text provides information on Figure 3B, showing the mean increase in peak urine flow rate in Study 2. The graph seems to involve data related to different treatments and durations of treatment in weeks.*
FDA Label Image

Chemical Structure (Tamsulosin Str)

* These product label images have been analyzed using experimental machine learning. Please verify findings with the primary label text.