Finasteride Tablet, Film Coated
Product Images NDC 55154-2639

View Photos of Packaging, Regulatory Labels, and Product Appearance

Product Visual Gallery

This gallery contains 9 technical images submitted to the FDA as part of the official labeling for Finasteride (NDC 55154-2639). Unlike standard consumer photos, these assets often include clinical data figures, molecular chemical structures, and official manufacturer packaging layouts.

As provided by Cardinal Health 107, Llc, these visuals offer a comprehensive scientific overview of the product's physical and chemical identity, aiding pharmacists and researchers in product verification and study.

FDA Label Image

5mg Bag Label (22161236 6804 4a7f 86cb Cfa20bd1951e 00)
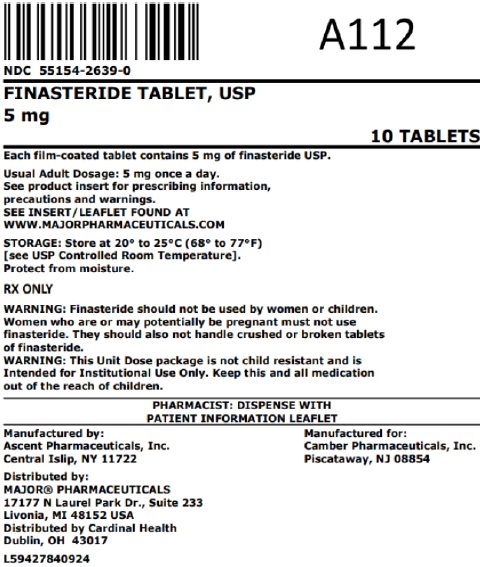
5mg Bag Label (22161236 6804 4a7f 86cb Cfa20bd1951e 00)
Drug facts and warnings panel for Finasteride Tablet USP 5 mg, 10 tablets. Details include dosage, storage instructions, and warnings such as use restrictions for women and children, and information about the packaging not being child resistant. Manufacturer, distributor, and labeler information is also provided.*
FDA Label Image

Address.jpg (Address)

FDA Label Image

Address3.jpg (Address3)

FDA Label Image

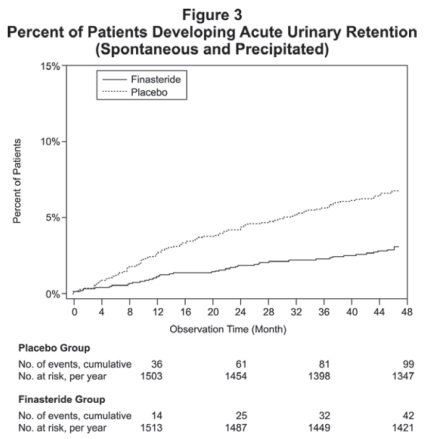
Figure (Figure)

Figure (Figure)
Line graph showing the percent of patients developing acute urinary retention over 48 months, comparing Finasteride and placebo groups. The graph includes cumulative event counts and patients at risk per year for both groups, with Finasteride demonstrating a lower incidence than placebo across the observation period.*
FDA Label Image

Figure1.jpg (Figure1)

Figure1.jpg (Figure1)
A line graph comparing mean change from baseline over four years between Finasteride and placebo groups. The x-axis shows time points from baseline through year 4, and the y-axis shows mean change values. Finasteride shows a consistent decrease over time, while placebo remains near baseline.*
FDA Label Image

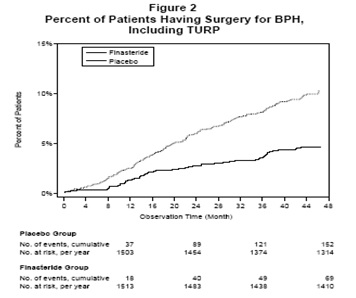
Figure2.jpg (Figure2)

Figure2.jpg (Figure2)
A line graph titled 'Percent of Patients Having Surgery for BPH, Including TURP' comparing the percentage of patients undergoing surgery over time between Finasteride and Placebo groups. The x-axis shows observation time in months (0 to 48), and the y-axis shows the percent of patients (0% to 15%). Two lines represent Finasteride (lower line) and Placebo (higher line), with Placebo showing a higher surgery rate over time. Below the chart, data tables list cumulative events and number at risk per year for both groups.*
FDA Label Image

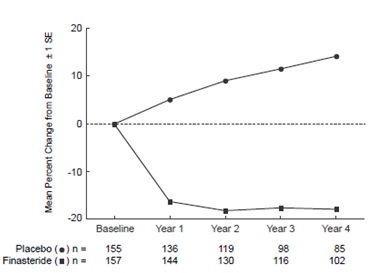
Figure3.jpg (Figure3)

Figure3.jpg (Figure3)
A line graph showing mean percent change from baseline with standard error for two groups: placebo and finasteride, over a 4-year period. The x-axis represents time points from baseline through year 4, and the y-axis shows percent change ranging from -20 to +20. Placebo group data trend upward, while finasteride group data trend downward or remain stable over time.*
FDA Label Image

Figure4.jpg (Figure4)

Figure4.jpg (Figure4)
A line graph showing percent of subjects with an event over 5.5 years from randomization across four groups: Placebo, Finasteride, Doxazosin, and Combination. The percent with event increases over time, highest in Placebo and lowest in Combination group.*
FDA Label Image

Structure.jpg (Structure)

Structure.jpg (Structure)
Chemical structure of Finasteride, showing its characteristic steroidal backbone with functional groups including a keto group and an amide derivative.*

* About these descriptions: Image descriptions on this page are generated by automated AI analysis of the product label images from the manufacturer's FDA label submission (SPL). They are provided for reference only and may contain errors or omissions. Always rely on the printed label itself and the official FDA labeling, and consult a pharmacist or healthcare professional with any questions about this product.