Sevelamer Hydrochloride Tablet, Film Coated
Product Images NDC 55154-2647

View Photos of Packaging, Regulatory Labels, and Product Appearance

Product Visual Gallery

This gallery contains 5 technical images submitted to the FDA as part of the official labeling for Sevelamer Hydrochloride (NDC 55154-2647). Unlike standard consumer photos, these assets often include clinical data figures, molecular chemical structures, and official manufacturer packaging layouts.

As provided by Cardinal Health 107, Llc, these visuals offer a comprehensive scientific overview of the product's physical and chemical identity, aiding pharmacists and researchers in product verification and study.

FDA Label Image

800mg Bag Label (C13532a7 4c56 4084 839d 3dcfd4dc30f8 00)

800mg Bag Label (C13532a7 4c56 4084 839d 3dcfd4dc30f8 00)
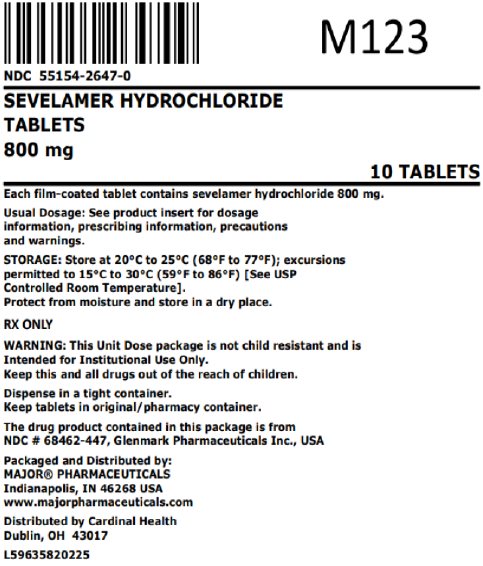
This is information on Sevelamer Hydrochloride Tablets, each containing 800 mg of the active ingredient. The usual dosage is specified in the product insert. The tablets should be stored at a temperature between 20°C to 25°C and protected from moisture. It is important to keep this medication and all drugs out of the reach of children and dispense them in a tight container. This particular package is not child-resistant and is intended for institutional use only. The tablets are distributed by Major Pharmaceuticals and packaged by Glenmark Pharmaceuticals Inc. in the USA.*
FDA Label Image

Chemical-structure (Chemical Structure)

FDA Label Image

Figure-2 (Figure 2)

Figure-2 (Figure 2)
This data provides information on the reduction in serum phosphorus levels for patients using Sevelamer Hydrochloride compared to an active control group. The table indicates the percentage of patients with reduction greater than a certain value X, as well as showing the reduction from baseline levels categorized as worsened, improved, or remaining constant. Sevelamer Hydrochloride appears to demonstrate efficacy in lowering serum phosphorus levels, with potential benefits for patients with conditions related to high phosphorus levels.*
FDA Label Image

Figure-3 (Figure 3)

Figure-3 (Figure 3)
This is a report showing the change in phosphorus levels from baseline for the treatment group receiving Sevelamer Hydrochloride compared to the active-control group. The measurements were taken at weeks 14, 18, 26, 30, 34, 38, and 42 of the study.*
FDA Label Image

* These product label images have been analyzed using experimental machine learning. Please verify findings with the primary label text.