Lovenox Injection
Product Images NDC 55154-4028

10 FDA label images from Cardinal Health 107, Llc · Packaging, Regulatory Labels, and Product Appearance

Product Visual Gallery

This gallery contains 10 technical images submitted to the FDA as part of the official labeling for Lovenox (NDC 55154-4028). Unlike standard consumer photos, these assets often include clinical data figures, molecular chemical structures, and official manufacturer packaging layouts.

As provided by Cardinal Health 107, Llc, these visuals offer a comprehensive scientific overview of the product's physical and chemical identity, aiding pharmacists and researchers in product verification and study.

FDA Label Image

42196383 88a9 4d87 8b9b 86136104547c 00

42196383 88a9 4d87 8b9b 86136104547c 00
Label for Lovenox 40 mg/0.4 mL injection, enoxaparin sodium, provided in a package of 5 single-dose syringes with automatic safety device for subcutaneous injection. Distributed by Cardinal Health, this label details dose form, storage instructions, warnings, and directions for use of the syringe's safety features.*
FDA Label Image

Figure A (Lovenox 01)

Figure A (Lovenox 01)
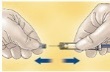
An instructional illustration showing hands holding a syringe and pulling back the plunger, indicated by blue arrows, likely demonstrating how to prepare the injection.*
FDA Label Image

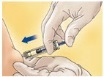
Figure B (Lovenox 02)

Figure B (Lovenox 02)
An instructional illustration showing a hand administering a subcutaneous injection using a prefilled syringe. The image depicts the syringe needle being inserted at the side of a finger, with an arrow indicating the direction of pressing the plunger to deliver the injection.*
FDA Label Image

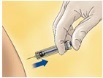
Figure C (Lovenox 03)

Figure C (Lovenox 03)
An instructional illustration showing a hand wearing a glove administering a subcutaneous injection with a syringe into a person's skin. The syringe is positioned just above the injection site, demonstrating proper injection technique for a subcutaneous route.*
FDA Label Image

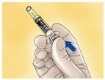
Figure D (Lovenox 04)

Figure D (Lovenox 04)
An instructional illustration showing a hand holding a prefilled syringe with a blue safety shield. The syringe is positioned for subcutaneous injection, suggesting proper technique for Lovenox injection administration.*
FDA Label Image

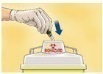
Figure E (Lovenox 05)

Figure E (Lovenox 05)
An instructional illustration showing a hand holding a vial above a device, likely demonstrating the preparation or use of an injection product. The image focuses on the manual handling step and the device involved in administering or preparing the dose.*
FDA Label Image

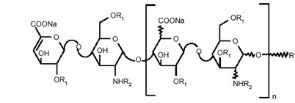
Chemical Structure (Lovenox 06)

Chemical Structure (Lovenox 06)
Chemical structure of enoxaparin sodium depicted as a polymeric polysaccharide chain with repeating units, showing functional groups such as carboxylate (COONa), hydroxyl (OH), amine (NHR2), and acyl groups (OR1). This structural diagram represents the active ingredient in Lovenox injectable solution.*
FDA Label Image

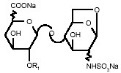
Chemical Structure (Lovenox 07)

Chemical Structure (Lovenox 07)
Chemical structure of enoxaparin sodium, the active ingredient in Lovenox, showing its molecular components and bonding arrangement.*
FDA Label Image

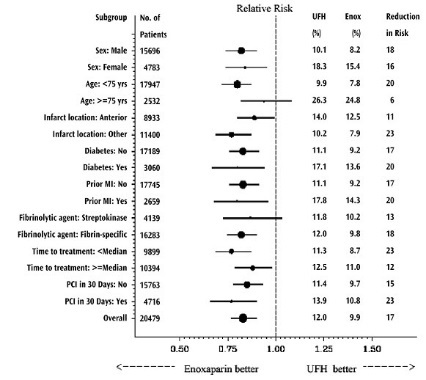
Figure 1 (Lovenox 08)

Figure 1 (Lovenox 08)
A forest plot chart showing relative risk comparisons between enoxaparin sodium (Enox) and unfractionated heparin (UFH) across various patient subgroups. The chart includes subgroups by sex, age, infarct location, diabetes status, prior myocardial infarction, fibrinolytic agent used, time to treatment, and PCI within 30 days. Points on the horizontal scale indicate relative risk, with enoxaparin favored to the left and UFH to the right. Numerical values for each group are shown for UFH and enox percentages and risk reduction.*
FDA Label Image

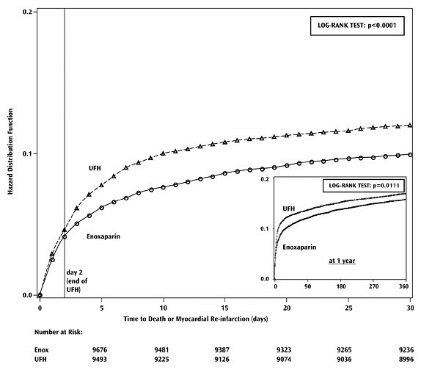
Figure 2 (Lovenox 09)

Figure 2 (Lovenox 09)
A Kaplan-Meier hazard distribution curve comparing Enoxaparin and Unfractionated Heparin (UFH) over 30 days for time to death or myocardial reinfarction. The graph includes two hazard distribution curves, with Enoxaparin showing a lower hazard than UFH. An inset graph displays extended data for one year, also comparing Enoxaparin and UFH. The number of subjects at risk for each group at various time points is listed below the main graph.*

* About these descriptions: Image descriptions on this page are generated by automated AI analysis of the product label images from the manufacturer's FDA label submission (SPL). They are provided for reference only and may contain errors or omissions. Always rely on the printed label itself and the official FDA labeling, and consult a pharmacist or healthcare professional with any questions about this product.