Januvia Tablet, Film Coated
Product Images NDC 55154-5042

4 FDA label images from Cardinal Health 107, Llc · Packaging, Regulatory Labels, and Product Appearance

Product Visual Gallery

This gallery contains 4 technical images submitted to the FDA as part of the official labeling for Januvia (NDC 55154-5042). Unlike standard consumer photos, these assets often include clinical data figures, molecular chemical structures, and official manufacturer packaging layouts.

As provided by Cardinal Health 107, Llc, these visuals offer a comprehensive scientific overview of the product's physical and chemical identity, aiding pharmacists and researchers in product verification and study.

FDA Label Image

29d07a96 25ca 433d 9ee1 D11fcf88614c 00
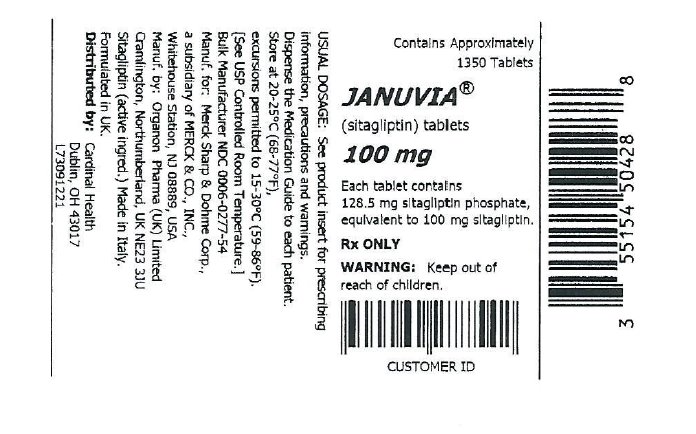
29d07a96 25ca 433d 9ee1 D11fcf88614c 00
JANUVIA 100 mg tablets film coated label showing sitagliptin as the active ingredient. The label states the product contains approximately 1350 tablets and includes dosage, storage, and warning information. The labeler is Cardinal Health 107, LLC. Visible is a barcode and details about distribution and manufacturing.*
FDA Label Image

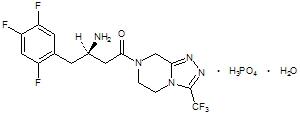
Image Of Sitagliptin Chemical Structure (Januvia 01)

Image Of Sitagliptin Chemical Structure (Januvia 01)
Chemical structure diagram showing the molecular formula of sitagliptin phosphate monohydrate, the active ingredient in JANUVIA 100 mg oral tablets. The structure includes fluorinated aromatic rings and nitrogen-containing heterocycles.*
FDA Label Image

Image Of Figure 1 (Januvia 02)

Image Of Figure 1 (Januvia 02)
A line graph depicting least squares mean change from baseline over 24 weeks, comparing placebo, metformin 1000 mg b.i.d., metformin 500 mg b.i.d., sitagliptin 100 mg q.d., sitagliptin 50 mg b.i.d. plus metformin 500 mg b.i.d., and sitagliptin 50 mg b.i.d. plus metformin 1000 mg b.i.d. The x-axis represents time in weeks and the y-axis represents the mean change from baseline.*
FDA Label Image

Image Of Figure 2 (Januvia 03)

Image Of Figure 2 (Januvia 03)
A line graph comparing the least squares mean change from baseline over 52 weeks between Janumet 100 mg and Glipizide. The x-axis represents weeks, and the y-axis shows the change with values decreasing up to around -1.2 before rising slightly by week 52. Data points for both treatments are closely aligned throughout the study period.*

* About these descriptions: Image descriptions on this page are generated by automated AI analysis of the product label images from the manufacturer's FDA label submission (SPL). They are provided for reference only and may contain errors or omissions. Always rely on the printed label itself and the official FDA labeling, and consult a pharmacist or healthcare professional with any questions about this product.