Formula Calculation For Patients With Renal Impairment (A518c4f5 8b66 4770 B971 3534d581ca99 02)
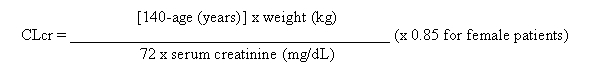
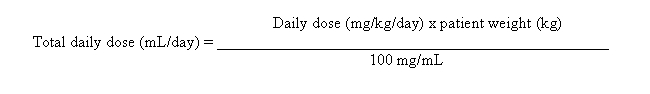
This text provides a formula for calculating the appropriate weight in kilograms for an individual based on their age in years. It also gives a correction factor for female patients. Additionally, it includes a measurement for serum creatinine in milligrams per deciliter.*