Myrbetriq
Product Images NDC 55154-8713

17 FDA label images from Cardinal Health 107, Llc · Packaging, Regulatory Labels, and Product Appearance

Product Visual Gallery

This gallery contains 17 technical images submitted to the FDA as part of the official labeling for Myrbetriq (NDC 55154-8713). Unlike standard consumer photos, these assets often include clinical data figures, molecular chemical structures, and official manufacturer packaging layouts.

As provided by Cardinal Health 107, Llc, these visuals offer a comprehensive scientific overview of the product's physical and chemical identity, aiding pharmacists and researchers in product verification and study.

FDA Label Image

Astellas Logo (Image 02)

FDA Label Image

Astellas Logo (Image 03)

FDA Label Image

Mirabegron Structural Formula (Image 01)

Mirabegron Structural Formula (Image 01)
Chemical structure of the active ingredient in Myrbetriq, showing the molecular arrangement with benzene rings, amide, hydroxyl, and thiadiazole groups.*
FDA Label Image

Figure 1 (Image 08)

Figure 1 (Image 08)
A forest plot chart showing fold changes with 90% confidence intervals in pharmacokinetic parameters AUC and Cmax for various drugs co-administered relative to mirabegron alone. The drugs include Ketoconazole 400 mg, Rifampicin 600 mg, Solifenacin 10 mg, Tamsulosin 0.4 mg, and Metformin 500 mg, with recommendations indicating no dose adjustment for all. The x-axis represents the mean change relative to mirabegron alone.*
FDA Label Image

Figure 2 (Image 09)

Figure 2 (Image 09)
A forest plot chart showing the pharmacokinetic fold change and 90% confidence intervals for various CYP3A4, CYP2D6 substrates, and other drugs when administered with Myrbetriq. It compares mean changes in AUC and Cmax relative to the substrate alone, including dosage recommendations like no dose adjustment or caution advice.*
FDA Label Image

Figure 3 (Image 10)

Figure 3 (Image 10)
Line chart showing mean change from baseline over 12 weeks for Myrbetriq 50 mg compared to placebo. The x-axis represents time in weeks (baseline, 4, 8, 12), and the y-axis shows mean change from baseline. Data points are plotted with error bars for placebo and Myrbetriq groups (n=291 and n=293 respectively), demonstrating a greater decrease for Myrbetriq 50 mg.*
FDA Label Image

Figure 4 (Image 11)

Figure 4 (Image 11)
A line graph showing mean change from baseline over 12 weeks comparing placebo and mirabegron 50 mg. The x-axis represents time in weeks (BL, 4, 8, 12), and the y-axis shows the mean change from baseline. Two lines illustrate the changes for placebo and mirabegron 50 mg groups, with data points and error bars for each time point.*
FDA Label Image

Figure 5 (Image 12)

Figure 5 (Image 12)
A line graph comparing the mean change from baseline over 12 weeks between placebo and mirabegron 50 mg groups. The x-axis shows weeks (BL, 4, 8, 12), and the y-axis represents mean change from baseline, with mirabegron showing a greater decrease than placebo across the time points.*
FDA Label Image

Figure 6 (Image 13)

Figure 6 (Image 13)
A line graph comparing mean change from baseline over 12 weeks between placebo and mirabegron 50 mg groups. The x-axis represents weeks (BL, 4, 8, 12) and the y-axis shows mean change values. Mirabegron shows a greater decrease from baseline than placebo throughout the period.*
FDA Label Image

Figure 7 (Image 14)

Figure 7 (Image 14)
A line graph depicting mean change from baseline over 12 weeks for Myrbetriq (mirabegron) at 25 mg and 50 mg doses compared to placebo. The x-axis represents weeks (BL, 4, 8, 12) and the y-axis shows mean change from baseline, with data points and error bars for each group.*
FDA Label Image

Figure 8 (Image 15)

Figure 8 (Image 15)
A line graph comparing mean change from baseline over 12 weeks for three groups: placebo (n=415), mirabegron 25 mg (n=410), and mirabegron 50 mg (n=426). The x-axis shows weeks (baseline, 4, 8, 12), and the y-axis shows mean change from baseline with error bars.*
FDA Label Image

Figure 9 (Image 16)

Figure 9 (Image 16)
A line chart displaying adjusted change from baseline over time for various treatment groups. The x-axis shows visit time points (Baseline, Week 4, Week 8, Week 12, and End of Treatment with Last Observation Carried Forward), while the y-axis shows adjusted change from baseline values. Multiple lines represent different dosages and combinations of the drugs placebo M 25 mg, M 50 mg, S 5 mg, S+M 25 mg, and S+M 50 mg, each indicated by distinct symbols and line styles.*
FDA Label Image

Figure 10 (Image 17)

Figure 10 (Image 17)
A line chart showing the adjusted change from baseline over time for various dosages and combinations of a drug compared to placebo. The x-axis represents the visit timeline from Baseline through Week 4, Week 8, Week 12, and End of Treatment (EoT) with Last Observation Carried Forward (LOCF). The y-axis shows the adjusted change from baseline values ranging from 0.00 to -2.75. The chart includes data series for Placebo, M 25 mg, M 50 mg, S 5 mg, S + M 25 mg, and S + M 50 mg, each represented by distinct symbols and lines, tracking the trend of decreasing values over time.*
FDA Label Image

Logo.jpg (Image 04)

FDA Label Image

Logo.jpg (Image 05)

FDA Label Image

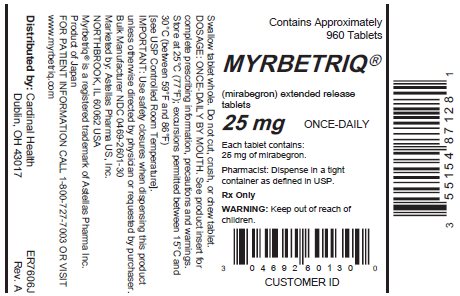
25mg Bottle Label (Fe8998d8 Cf08 4e07 B966 33e8de20abf1 01)

25mg Bottle Label (Fe8998d8 Cf08 4e07 B966 33e8de20abf1 01)
Myrbetriq 25 mg extended release tablets label showing the active ingredient mirabegron. The label indicates a once-daily oral dosage, contains approximately 960 tablets, and includes directions for dispensing and warnings. Distributed by Cardinal Health 107, LLC, Dublin, OH. Barcode and lot details are visible.*
FDA Label Image

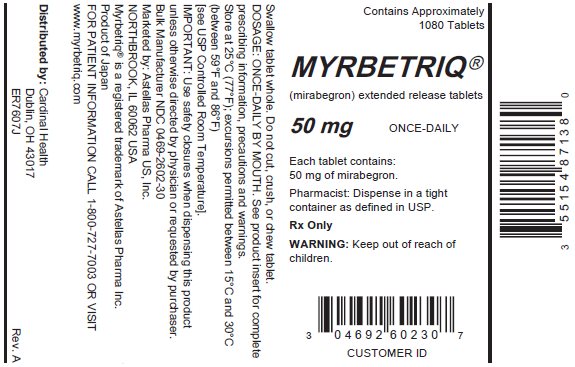
50mg Bottle Label (Fe8998d8 Cf08 4e07 B966 33e8de20abf1 00)

50mg Bottle Label (Fe8998d8 Cf08 4e07 B966 33e8de20abf1 00)
Label for Myrbetriq 50 mg extended release tablets containing mirabegron, manufactured by Cardinal Health 107, LLC. The label indicates the tablets are for once-daily use, prescription only, and includes instructions for storage between 15°C and 30°C. It advises to swallow tablets whole and includes warnings to keep out of reach of children. The label also features a barcode and distributor information.*

* About these descriptions: Image descriptions on this page are generated by automated AI analysis of the product label images from the manufacturer's FDA label submission (SPL). They are provided for reference only and may contain errors or omissions. Always rely on the printed label itself and the official FDA labeling, and consult a pharmacist or healthcare professional with any questions about this product.