Brilinta Tablet
Product Images NDC 55154-9618

View Photos of Packaging, Regulatory Labels, and Product Appearance

Product Visual Gallery

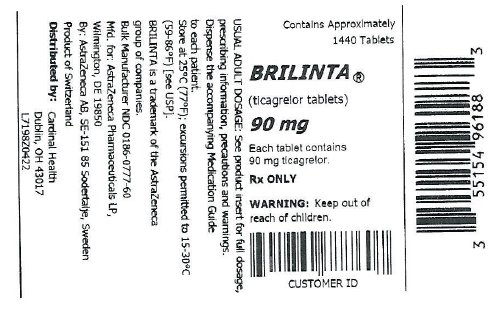
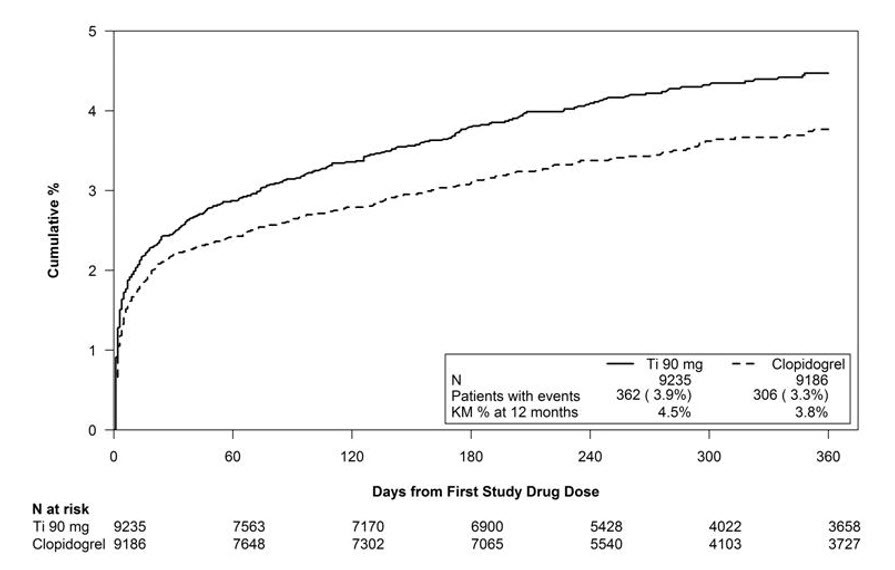
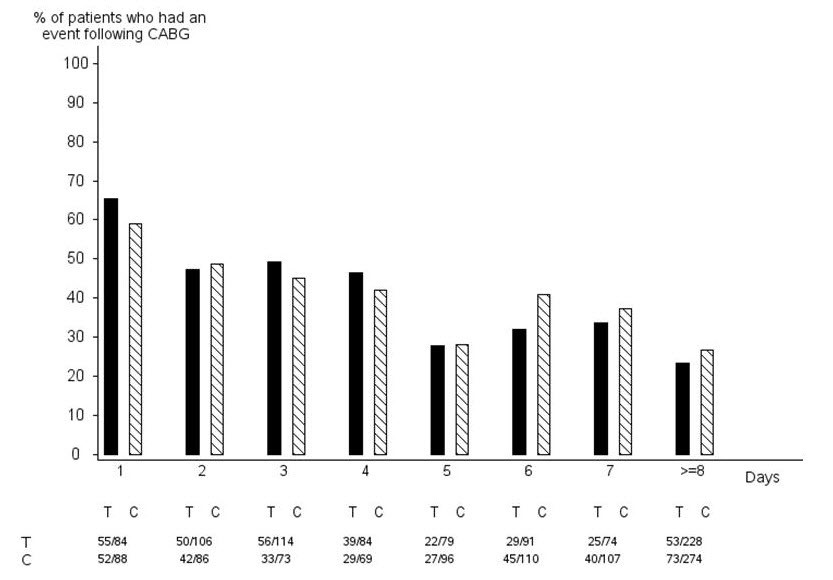
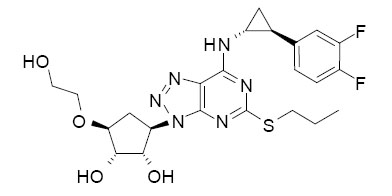
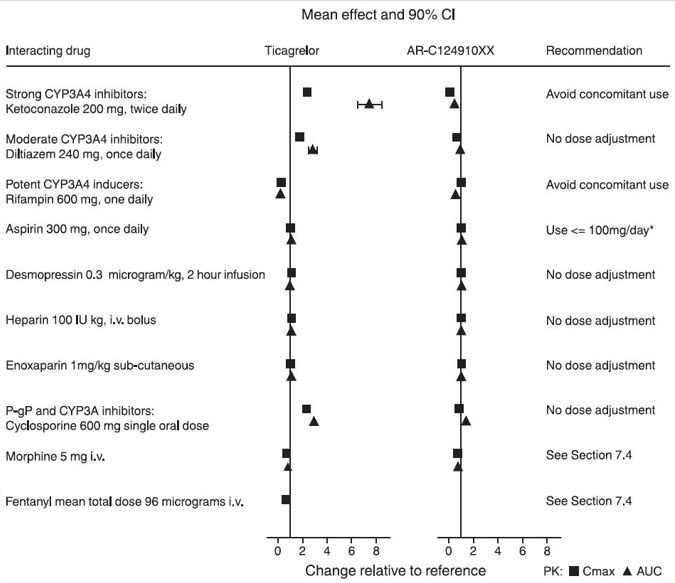
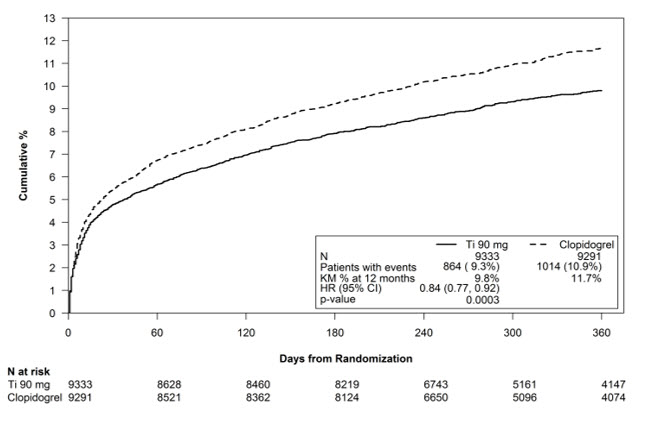
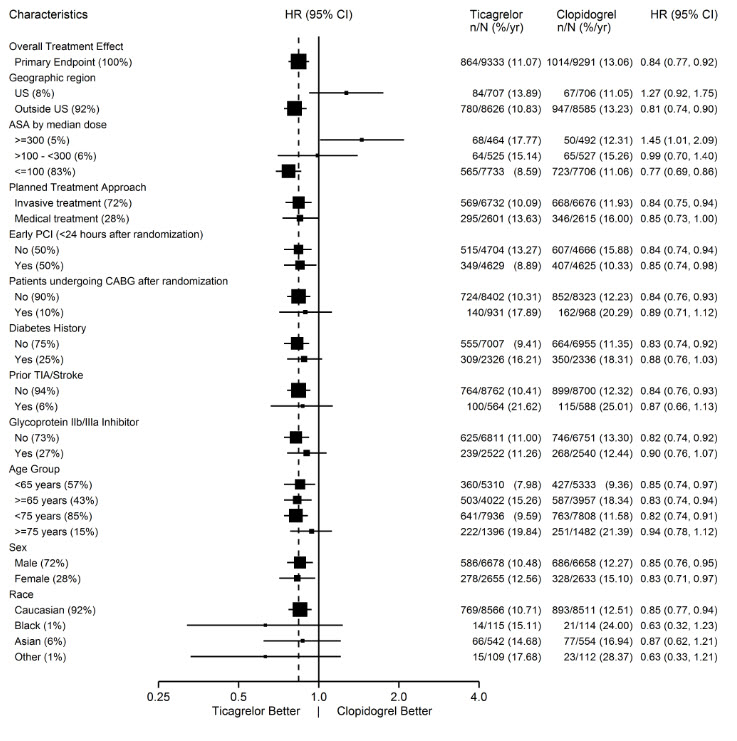
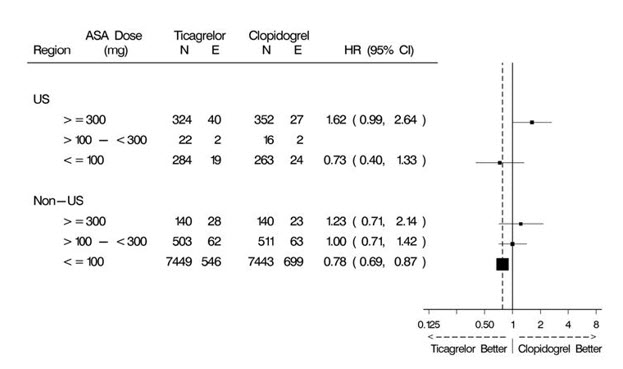
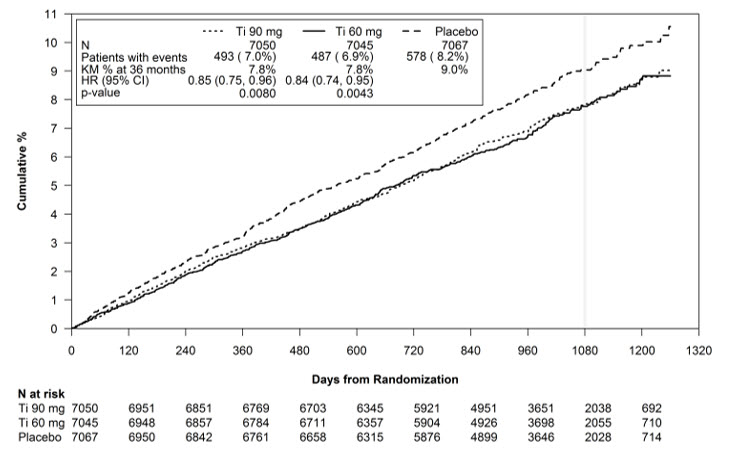
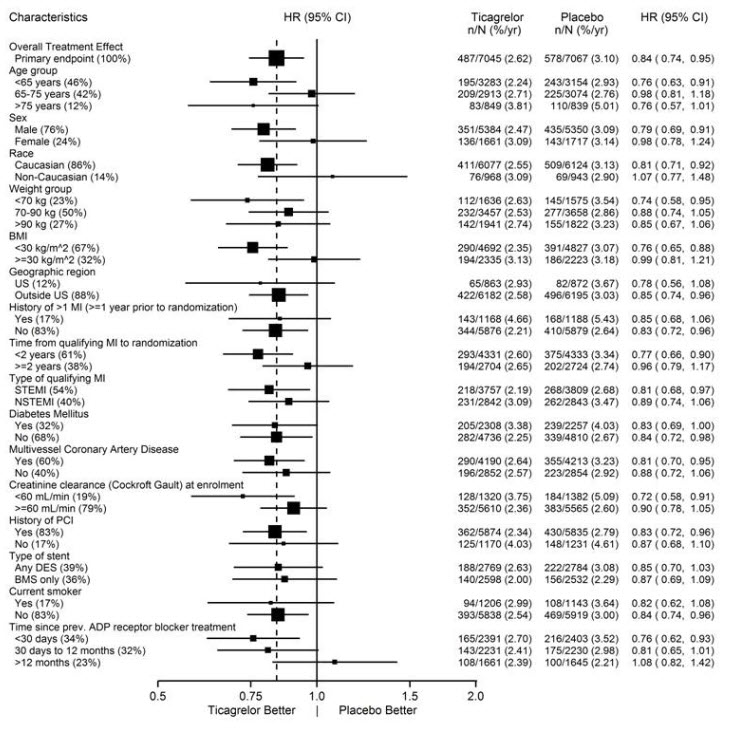
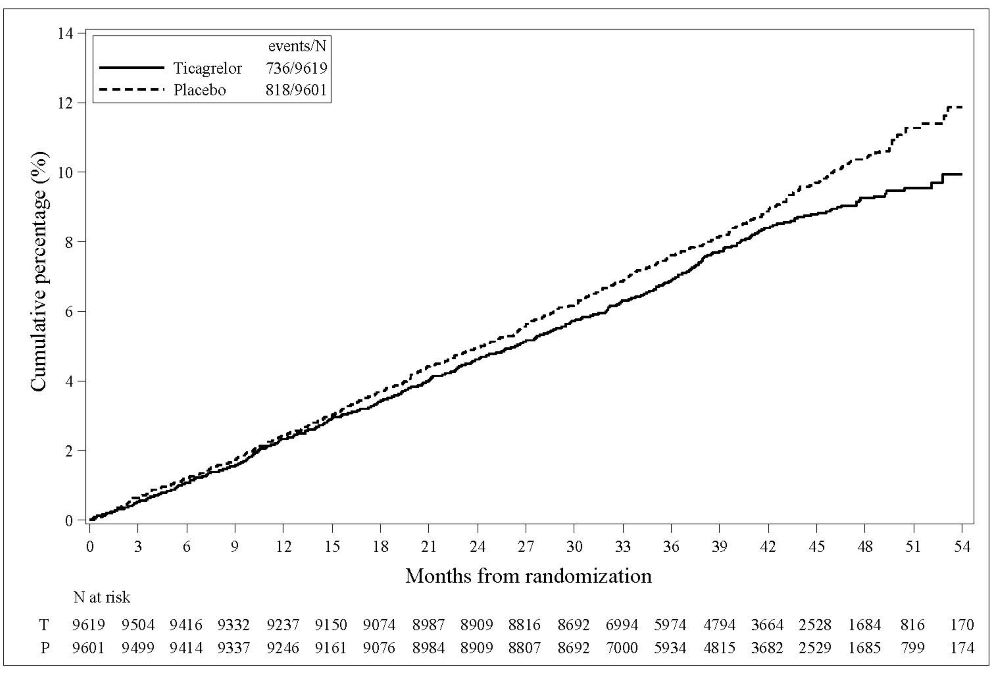
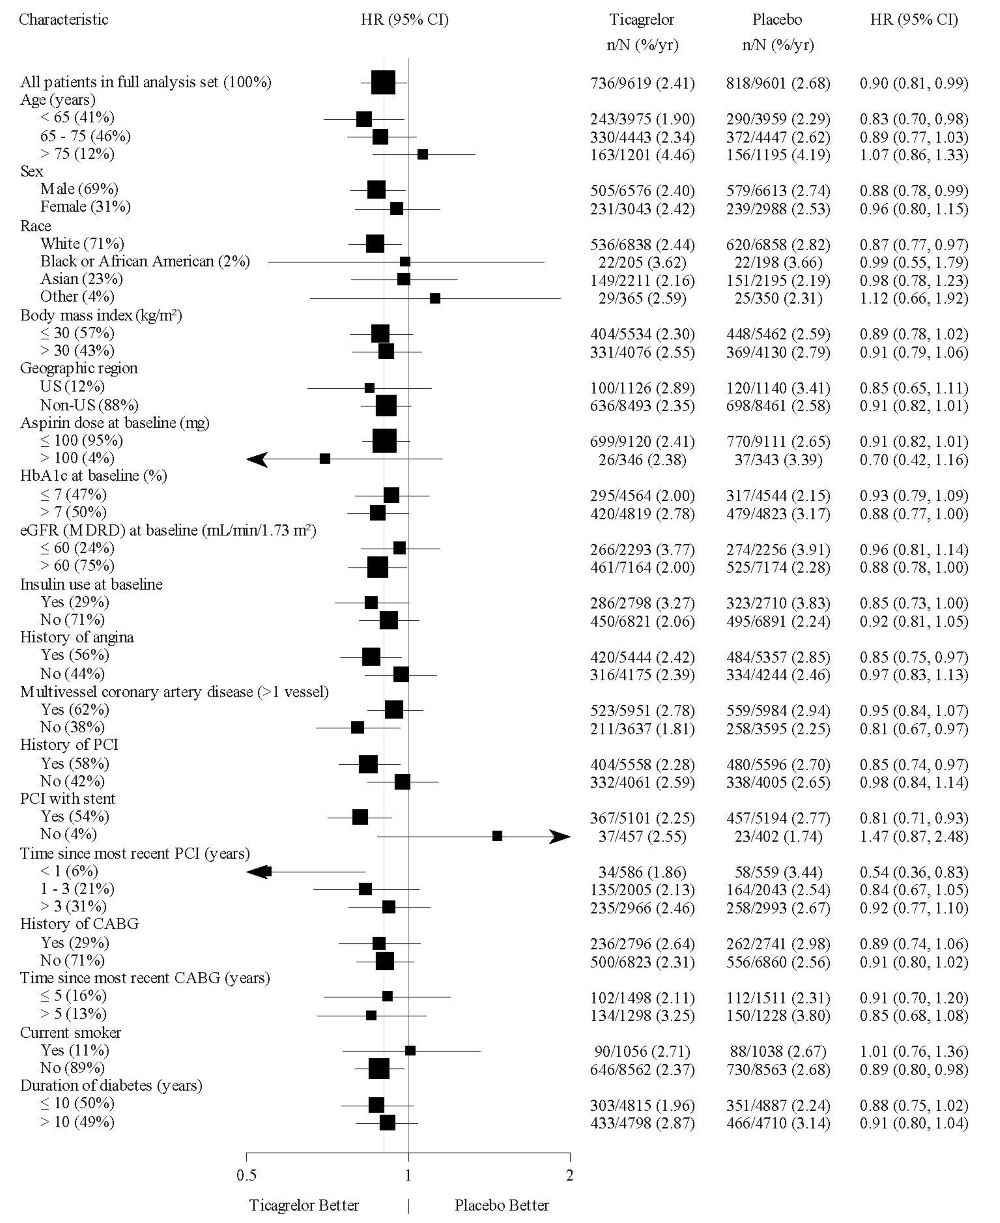
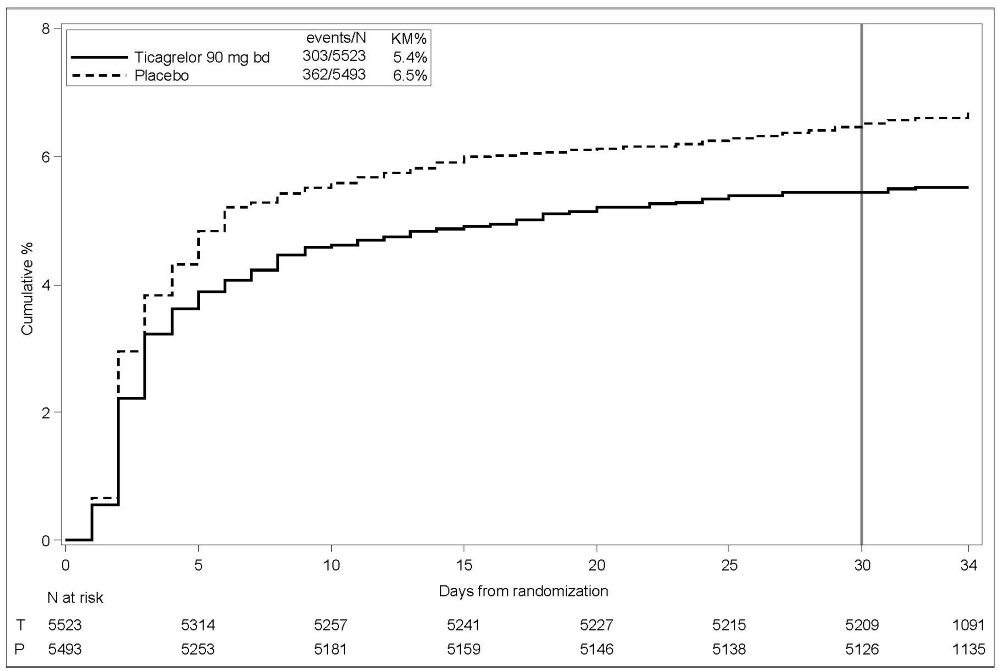
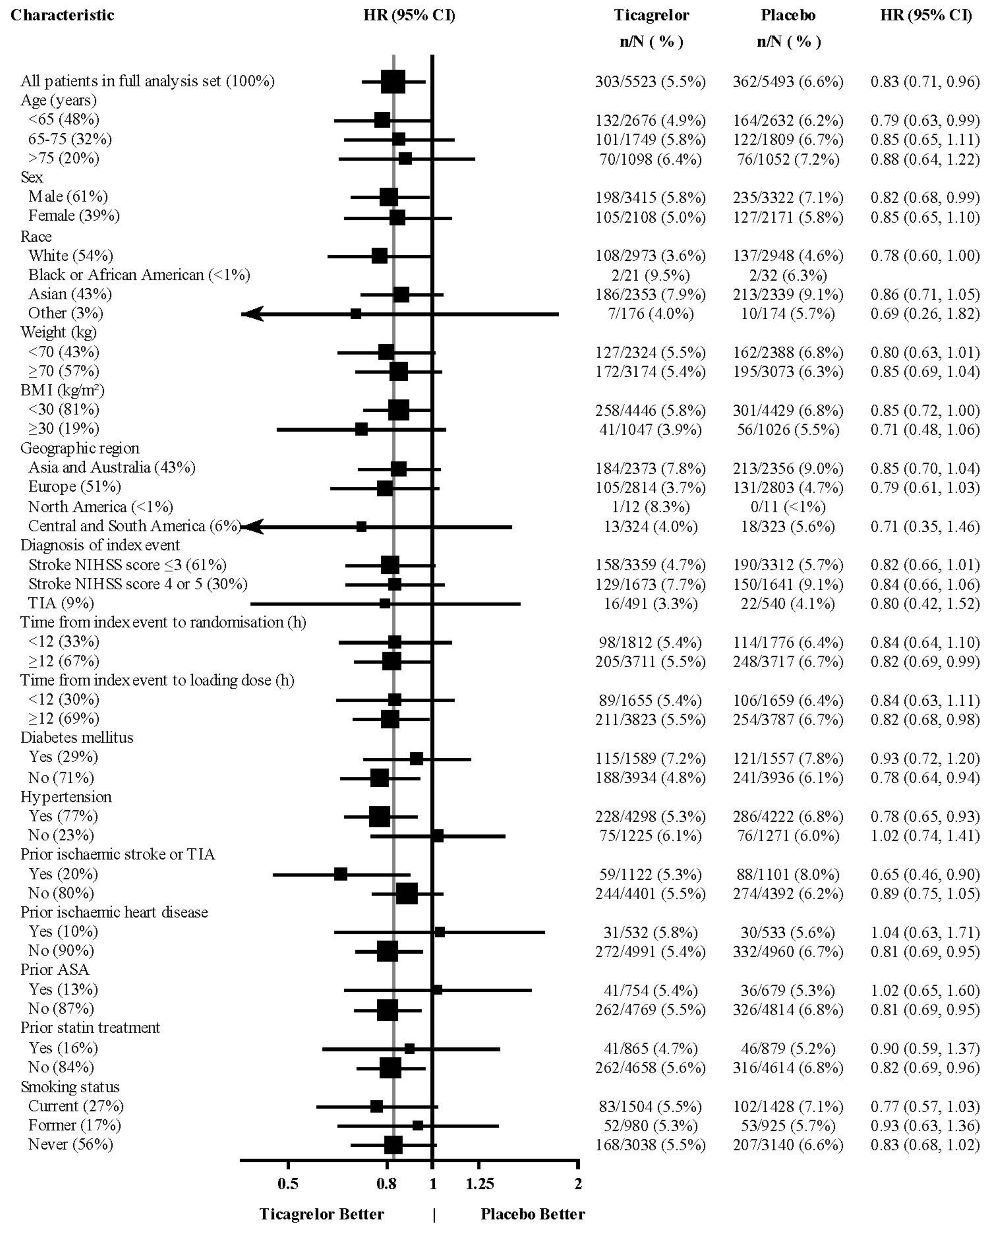
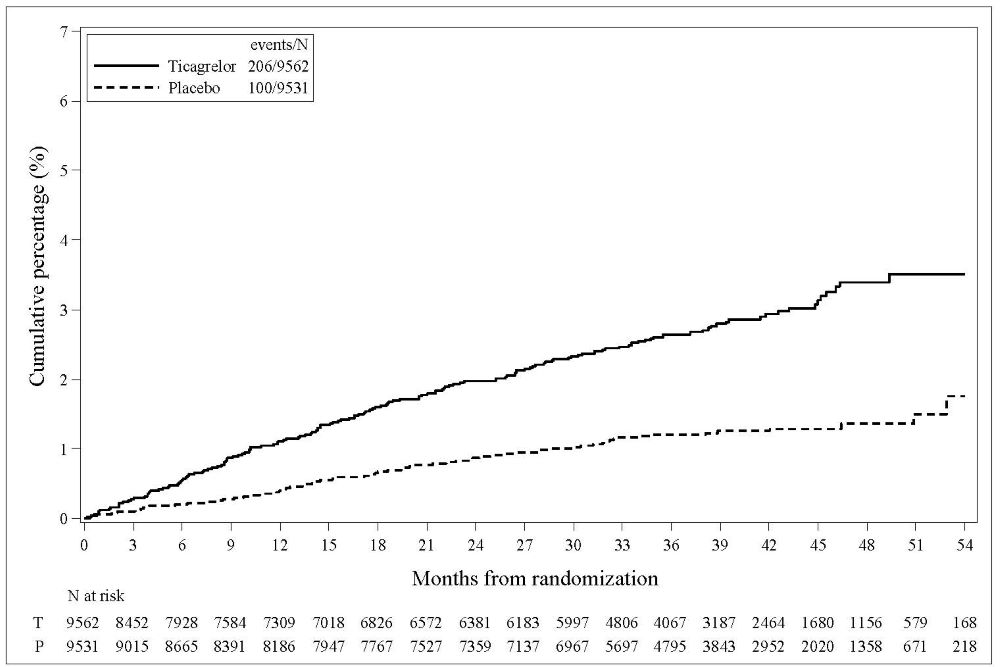
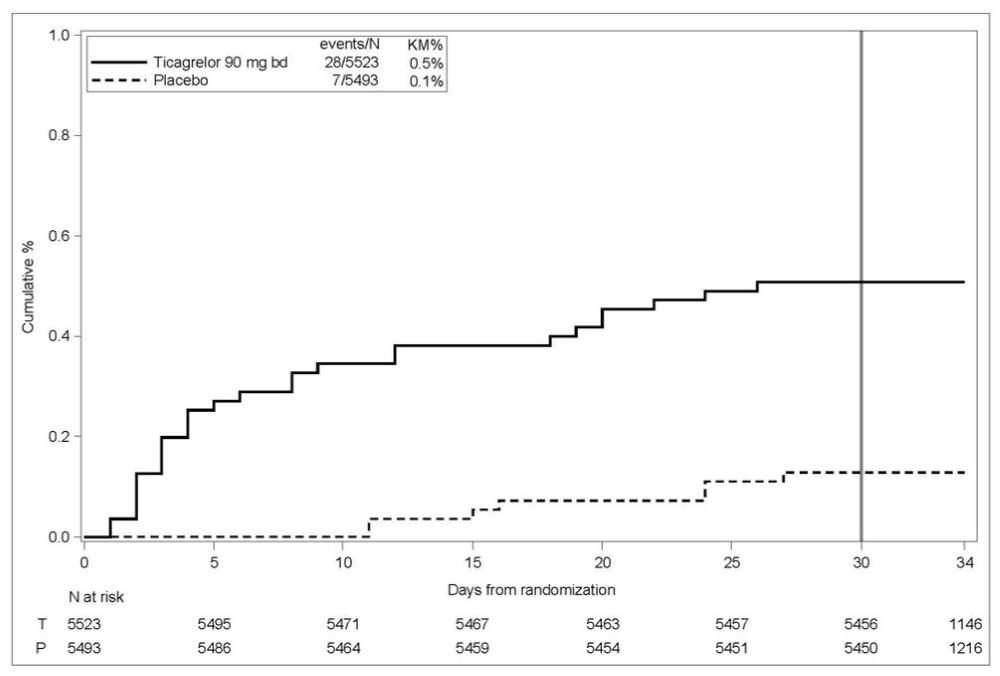
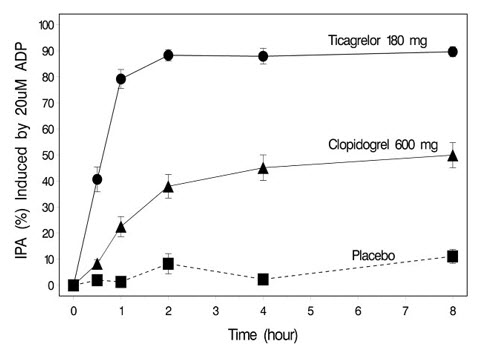
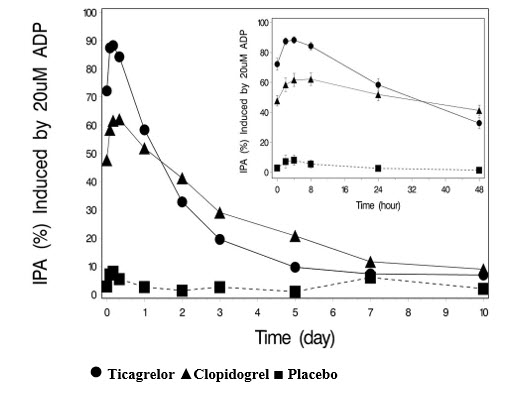
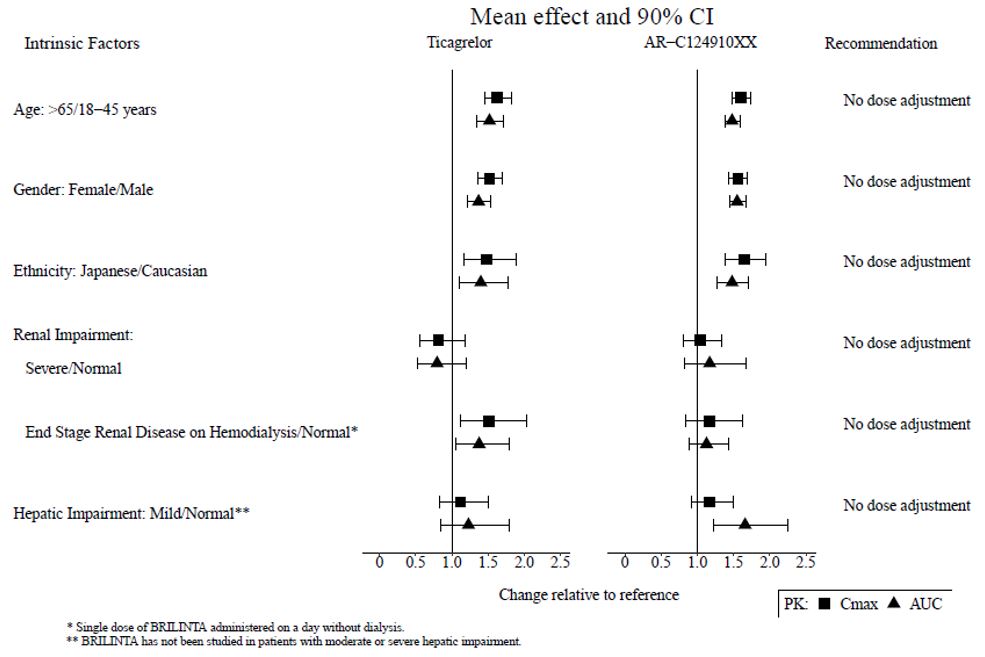
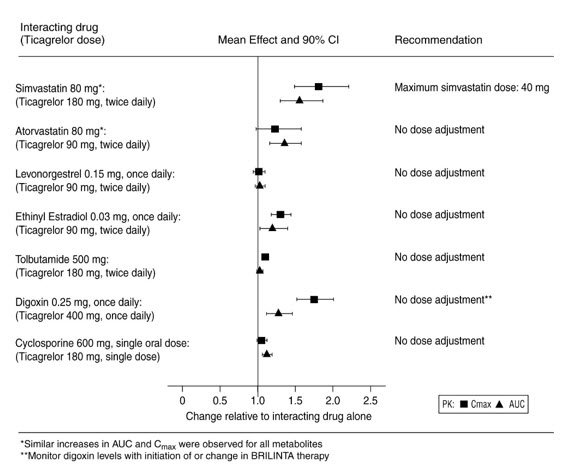
This gallery contains 20 technical images submitted to the FDA as part of the official labeling for Brilinta (NDC 55154-9618). Unlike standard consumer photos, these assets often include clinical data figures, molecular chemical structures, and official manufacturer packaging layouts.

As provided by Cardinal Health 107, Llc, these visuals offer a comprehensive scientific overview of the product's physical and chemical identity, aiding pharmacists and researchers in product verification and study.

FDA Label Image

8666a5c2 0bb9 4cd4 8d82 E91a108e8397 00

8666a5c2 0bb9 4cd4 8d82 E91a108e8397 00
Not available.*
FDA Label Image

Figure 1

Figure 1
This appears to be a table displaying data related to two drugs, Tigomg and Clopidogrel. The data shows the number of patients with events and the percentage of events at 12 months for each drug. The table also shows the number of patients at risk for each drug at various time points following the first drug dose. It is unclear what type of events are being referred to or what the drugs are used for.*
FDA Label Image

Figure 2

Figure 2
This is a graph showing the percentage of patients who experienced an event following Coronary Artery Bypass Grafting (CABG), plotted against the number of days post-surgery. The percentages are shown on the y-axis and range from 0-100%, while the x-axis shows the number of days after surgery. The graph also includes a table with numerical values that correspond to various time points.*
FDA Label Image

Chemical Structure

FDA Label Image

Figure 08

FDA Label Image

Figure 10

FDA Label Image

Figure 11

FDA Label Image

Figure 12

FDA Label Image

Figure 13

FDA Label Image

Figure 14

FDA Label Image

Figure 15

FDA Label Image

Figure 16

Figure 16
The excerpt provides data from a study (full analysis set) regarding patients who are treated with Ticagrelor. It includes different factors such as age, sex, race, body mass index, geographic region, HbAle at baseline, eGFR at baseline, insulin use, history of angina, multivessel coronary artery disease, history of PCI or CABG, diabetes, and duration of diabetes, and it presents the HR (with 95% CI) of Ticagrelor over the placebo in different categories.*
FDA Label Image

Figure 17

Figure 17
The text provides statistics of a clinical trial evaluating the efficacy of Ticagrelor 90 mg bd versus placebo. The trial involved 5523 participants receiving Ticagrelor and 5493 receiving placebo. The percentage of events was 5.4% and 6.5%, respectively. The text also shows a graph where "days from randomization" is presented in the x-axis and "N at risk" in the y-axis. There is not enough information to know the nature or type of the events, nor the purpose of the graph presented.*
FDA Label Image

Figure 18

Figure 18
This text seems to be a statistical report using HR (hazard ratio) to compare the efficacy of the drugs Ticagrelor and Placebo in treating patients with an index event (stroke or TIA). It provides data on characteristics of the patients in the full analysis set, such as age, sex, race, weight, and medical history. It also lists the geographic regions where the study was conducted and the time from index event to randomization and loading dose. However, it is not possible to clearly understand the format and meaning of the data presented without a more detailed context or explanation.*
FDA Label Image

Figure 3

Figure 3
This is a table showing the results of an event involving the medication Ticagrelor versus Placebo. It includes the number of patients who experienced the event out of the total number of patients in each group. There is also a chart displaying the cumulative percentage over time, with months since randomization on the X-axis and the percentage on the Y-axis. The text does not provide information about what the event or medication is.*
FDA Label Image

Figure 4

Figure 4
This text seems to be a medical chart showing the cumulative percentage of events and the number of patients who took Ticagrelor 90 mgbd compared to those who took Placebo, along with days from randomization. However, without additional context, it's difficult to provide more information.*
FDA Label Image

Figure 5

FDA Label Image

Figure 6

FDA Label Image

Figure 7

Figure 7
The given text relates to the mean effect and 90% CI of Ticagrelor AR-CI24910XX drug for patients with intrinsic factors like age, gender, ethnicity, renal impairment, and hepatic impairment. The recommendation for dose adjustment or non-adjustment based on these intrinsic factors is mentioned in the text. However, the results or effect of the drug are not clearly stated, making it difficult to determine its efficacy.*
FDA Label Image

Image 09

Image 09
This document appears to be a table displaying recommended dosage adjustments for patients taking Ticagrelor (BRILINTA) who are also taking other medications. The table lists various interacting drugs and provides recommendations for dose adjustment of Ticagrelor based on the interaction. The text also includes a note that similar pharmacokinetic results were observed on August 31, but there is not enough context to determine what this refers to.*

* These product label images have been analyzed using experimental machine learning. Please verify findings with the primary label text.