Rivaroxaban Tablet, Film Coated
Product Images NDC 55488-0540

View Photos of Packaging, Regulatory Labels, and Product Appearance

Product Visual Gallery

This gallery contains 16 technical images submitted to the FDA as part of the official labeling for Rivaroxaban (NDC 55488-0540). Unlike standard consumer photos, these assets often include clinical data figures, molecular chemical structures, and official manufacturer packaging layouts.

As provided by Changzhou Pharmaceutical Factory, these visuals offer a comprehensive scientific overview of the product's physical and chemical identity, aiding pharmacists and researchers in product verification and study.

FDA Label Image

Chemical Structure (Chemical Structure)

Chemical Structure (Chemical Structure)
Chemical structure diagram of rivaroxaban, showing the arrangement of its molecular components including rings, bonds, and functional groups, such as carbonyl, amide, and chlorine-substituted thiophene groups.*
FDA Label Image

Figure 1 (Figure 01)

Figure 1 (Figure 01)
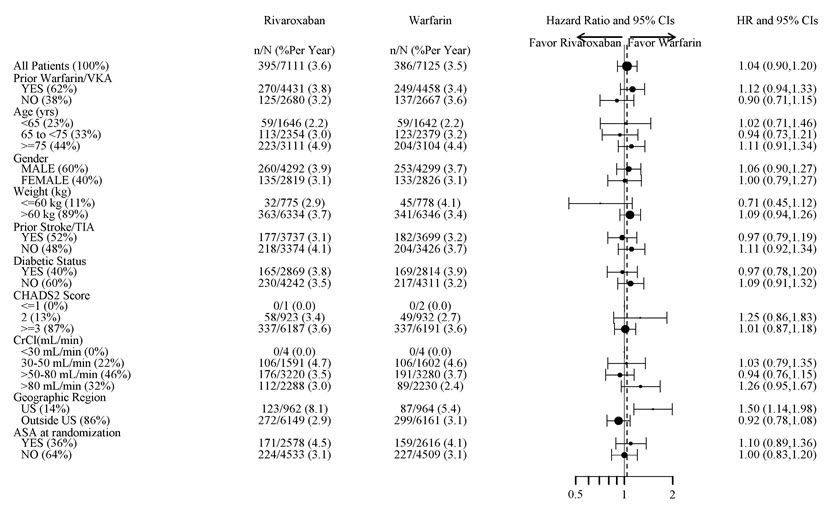
A forest plot chart comparing hazard ratios and 95% confidence intervals between rivaroxaban and warfarin across various patient subgroups such as age, gender, weight, prior stroke, diabetic status, CHADS2 score, creatinine clearance, geographic region, and ASA randomization. The chart visually represents the favorability of rivaroxaban or warfarin based on hazard ratios with markers and confidence bars aligned along a horizontal axis ranging from 0.5 to 2.*
FDA Label Image

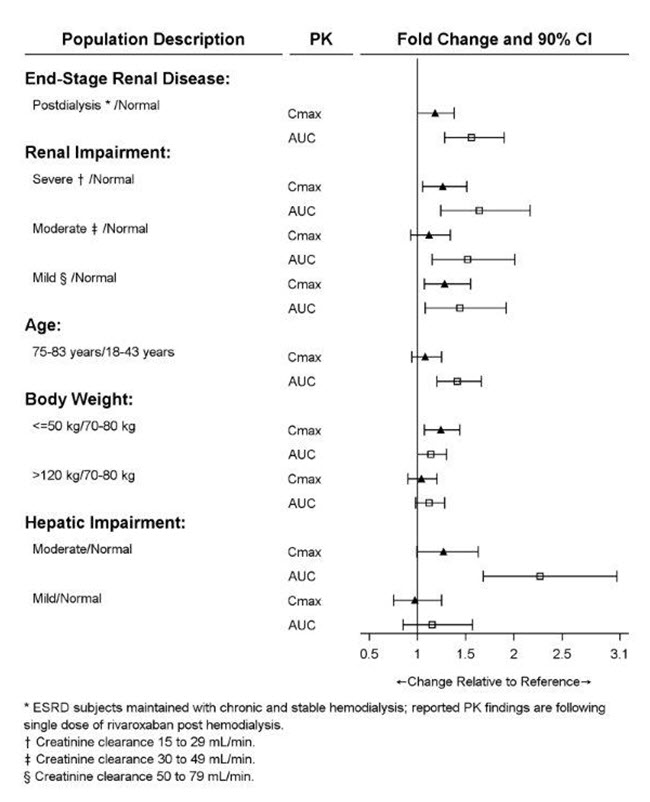
Figure 2 (Figure 02)

Figure 2 (Figure 02)
A pharmacokinetic (PK) chart showing fold change and 90% confidence intervals for rivaroxaban in various populations. It compares Cmax and AUC values relative to normal references in groups with end-stage renal disease, renal impairment (severe, moderate, mild), different ages, body weights, and hepatic impairment levels.*
FDA Label Image

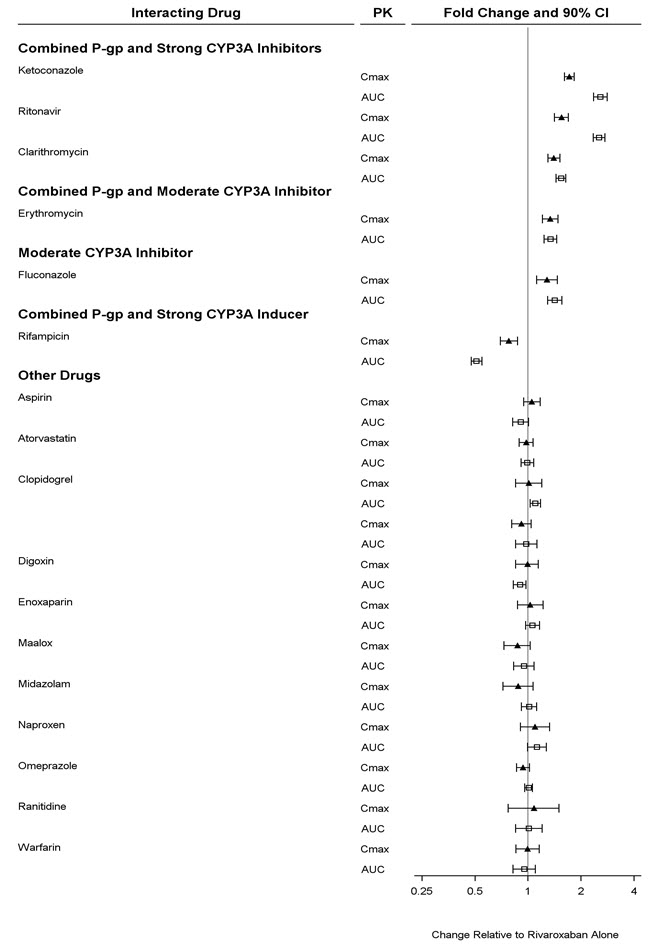
Figure 3 (Figure 03)

Figure 3 (Figure 03)
A chart illustrating the pharmacokinetic interactions for rivaroxaban with various drugs, showing fold change in Cmax and AUC values relative to rivaroxaban alone. The drugs are categorized into combined P-gp and strong or moderate CYP3A inhibitors, combined P-gp and strong CYP3A inducers, and other drugs, with confidence intervals displayed for each data point on a logarithmic scale from 0.25 to 4.*
FDA Label Image

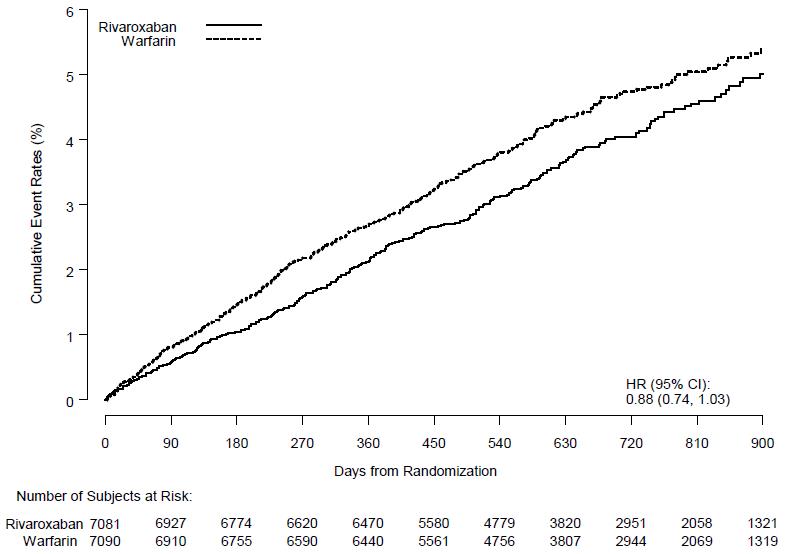
Figure 4 (Figure 04)

Figure 4 (Figure 04)
A line graph comparing cumulative event rates (%) over days from randomization for rivaroxaban and warfarin. The solid line represents rivaroxaban, and the dashed line represents warfarin. The x-axis shows time in days up to 900 days, and the y-axis shows cumulative event rates up to 6%. The graph includes the number of subjects at risk over time for each drug and a hazard ratio (HR) with 95% confidence interval displayed.*
FDA Label Image

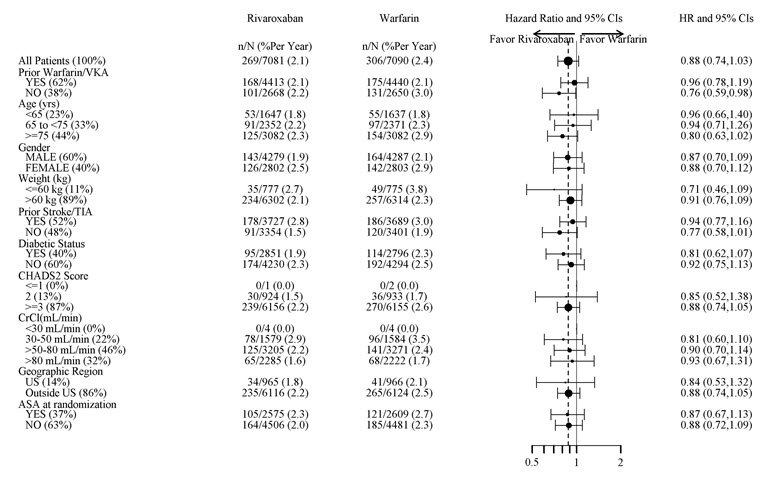
Figure 5 (Figure 05)

Figure 5 (Figure 05)
A forest plot chart comparing hazard ratios with 95% confidence intervals for rivaroxaban versus warfarin across various patient subgroups. The left side lists patient characteristics and subgroups, followed by numerical event rates for rivaroxaban and warfarin. The right side displays hazard ratio points and confidence intervals indicating favorability toward either drug.*
FDA Label Image

Figure 6 (Figure 06)

Figure 6 (Figure 06)
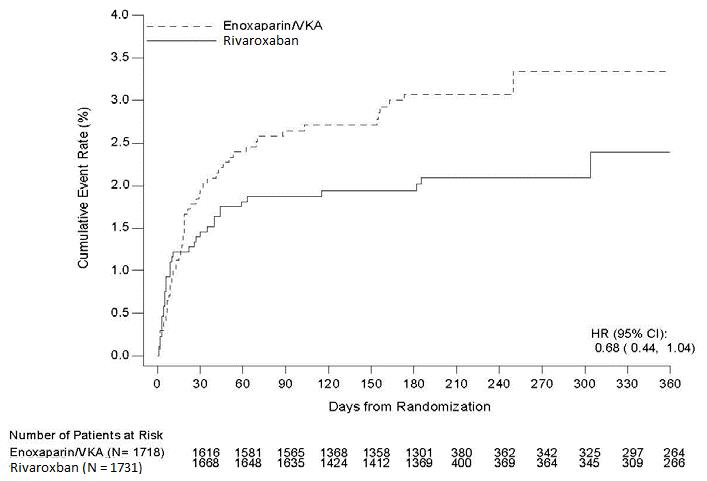
A line graph comparing cumulative event rates over days from randomization between Enoxaparin/VKA and Rivaroxaban. The y-axis shows cumulative event rate percentages, reaching up to 4%. The x-axis represents days from 0 to 360. The graph includes a table of patients at risk for each treatment group at various time points and a hazard ratio (HR) with confidence interval displayed in the lower right.*
FDA Label Image

Figure 7 (Figure 07)

Figure 7 (Figure 07)
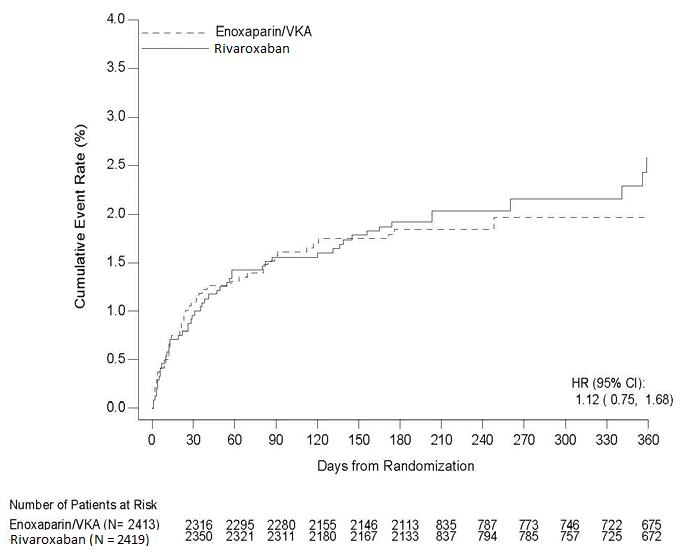
A line graph comparing the cumulative event rate (%) over days from randomization for Rivaroxaban and Enoxaparin/VKA in a patient population. The x-axis shows days from randomization (0 to 360), and the y-axis shows the cumulative event rate percentage (0 to 4%). Two lines represent event rates for Rivaroxaban and Enoxaparin/VKA over time. Patient numbers at risk at various time points are displayed below the x-axis. Hazard ratio (HR) with 95% confidence interval is noted on the graph.*
FDA Label Image

Figure 8 (Figure 08)

Figure 8 (Figure 08)
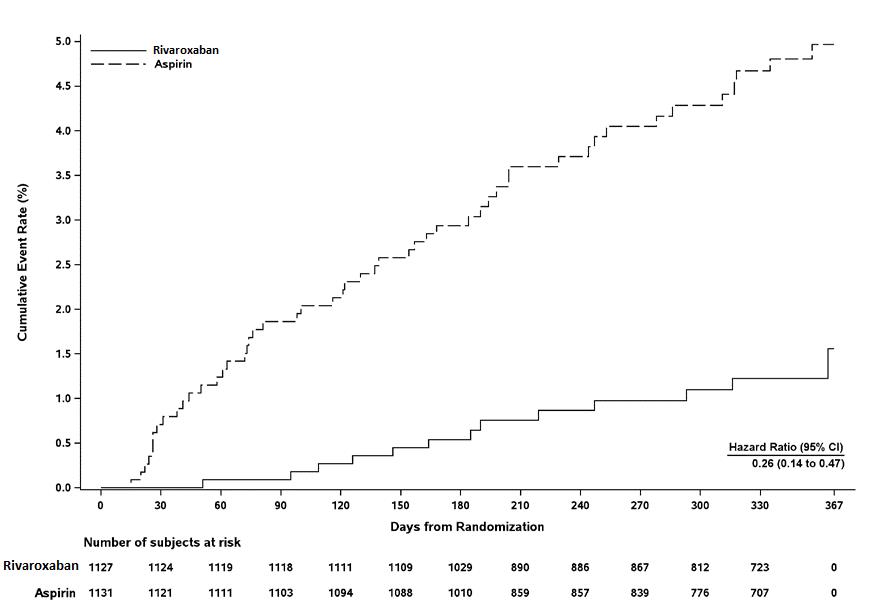
A cumulative event rate (%) graph comparing rivaroxaban and aspirin over days from randomization up to 367 days. The graph shows lower cumulative event rates for rivaroxaban (solid line) versus aspirin (dashed line). A hazard ratio with 95% confidence interval (0.26, 0.14 to 0.47) is noted. The number of subjects at risk at various time points is listed below the x-axis for both treatments.*
FDA Label Image

Figure 9 (Figure 09)

Figure 9 (Figure 09)
A forest plot chart comparing the efficacy outcomes of rivaroxaban versus placebo across various subgroups such as age, sex, region, weight, eGFR, myocardial infarction history, stroke history, heart failure history, baseline diabetes, and peripheral artery disease (PAD). The chart displays hazard ratios (HR) with 95% confidence intervals (CI) for each subgroup, illustrating the relative risk of composite stroke, myocardial infarction, or cardiovascular death.*
FDA Label Image

Figure 10 (Figure 10)

Figure 10 (Figure 10)
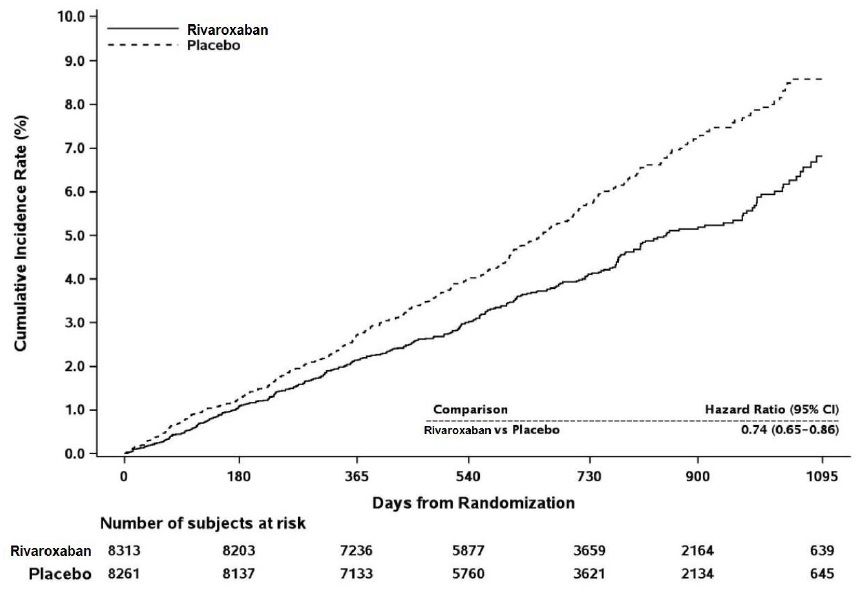
A line graph comparing cumulative incidence rates (%) over days from randomization for rivaroxaban and placebo. The x-axis represents days ranging from 0 to 1095, and the y-axis shows cumulative incidence rate percentages up to 10%. Two lines indicate rivaroxaban (solid line) and placebo (dashed line), with rivaroxaban showing a consistently lower incidence rate. A hazard ratio of 0.74 (95% CI 0.65-0.86) for rivaroxaban vs placebo is displayed. The number of subjects at risk at various time points is detailed below the x-axis for both groups.*
FDA Label Image

Figure 11 (Figure 11)

Figure 11 (Figure 11)
A line chart showing cumulative incidence rates over days from randomization comparing rivaroxaban treatment versus placebo. The graph plots percent incidence on the vertical axis against days up to 1095 on the horizontal axis, with rivaroxaban and placebo represented by solid and dashed lines respectively. A table below indicates numbers of subjects at risk over time for each group, and a hazard ratio with a 95% confidence interval is noted for the comparison between rivaroxaban and placebo.*
FDA Label Image

Figure 12 (Figure 12)

Figure 12 (Figure 12)
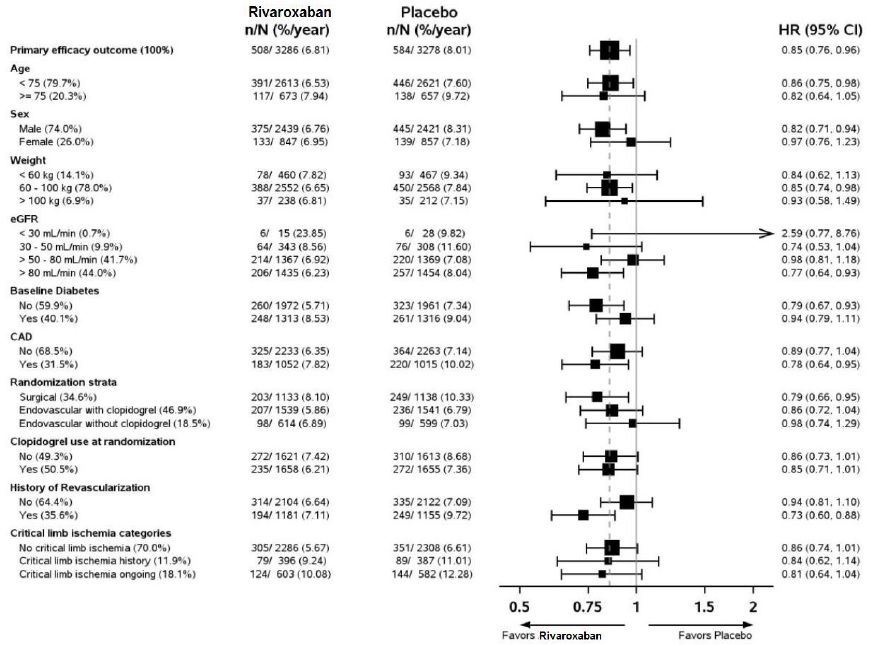
A forest plot comparing primary efficacy outcomes per year between rivaroxaban and placebo across various subgroups, including age, sex, weight, eGFR, baseline diabetes, CAD, randomization strata, clopidogrel use, history of revascularization, and critical limb ischemia categories. The hazard ratios with 95% confidence intervals are displayed, with a scale favoring rivaroxaban or placebo.*
FDA Label Image

10mg-30 Tablets (Label 01)

10mg-30 Tablets (Label 01)
Rivaroxaban Tablets, USP 10 mg film-coated tablet label. The label includes NDC 55488-0540-1, manufacturer and distributor Changzhou Pharmaceutical Factory, and a 30-tablet count. It specifies storage instructions, usual dosage reference, and a note to dispense the medication guide with each patient.*
FDA Label Image

15mg-30 Tablets (Label 04)

15mg-30 Tablets (Label 04)
Rivaroxaban Tablets USP 15 mg film-coated tablets label showing the dosage strength prominently on a green background. The label includes the NDC number 55488-0541-1, manufacturer and distributor Changzhou Pharmaceutical Factory, and package size of 30 tablets. Storage instructions, usage notice, and a barcode are also visible.*
FDA Label Image

20mg-30 Tablets (Label 07)

20mg-30 Tablets (Label 07)
Label for rivaroxaban tablets, USP 20 mg, film-coated oral tablets. The label shows a package size of 30 tablets and indicates the manufacturer as Changzhou Pharmaceutical Factory, China. It includes storage instructions, a barcode, and NDC 55488-0542-1.*

* About these descriptions: Image descriptions on this page are generated by automated AI analysis of the product label images from the manufacturer's FDA label submission (SPL). They are provided for reference only and may contain errors or omissions. Always rely on the printed label itself and the official FDA labeling, and consult a pharmacist or healthcare professional with any questions about this product.