Mvasi Injection, Solution
Product Images NDC 55513-207

11 FDA label images from Amgen, Inc · Packaging, Regulatory Labels, and Product Appearance

Product Visual Gallery

This gallery contains 11 technical images submitted to the FDA as part of the official labeling for Mvasi (NDC 55513-207). Unlike standard consumer photos, these assets often include clinical data figures, molecular chemical structures, and official manufacturer packaging layouts.

As provided by Amgen, Inc, these visuals offer a comprehensive scientific overview of the product's physical and chemical identity, aiding pharmacists and researchers in product verification and study.

FDA Label Image

Figure 1: Duration Of Survival In Study 1 (Mvasi 01)

Figure 1: Duration Of Survival In Study 1 (Mvasi 01)
A Kaplan-Meier survival curve comparing proportion surviving over duration of survival in months for two groups: IFL + Placebo and IFL + Bev. The graph includes numbers of patients at risk at various time points for each group, showing survival differences up to 30 months.*
FDA Label Image

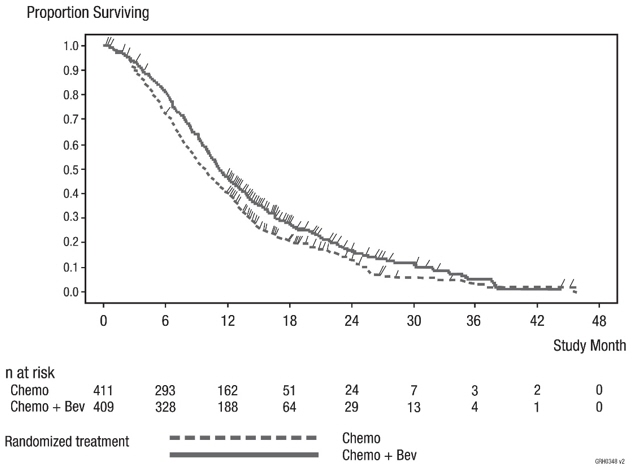
Figure 2: Duration Of Survival In Study 4 (Mvasi 02)

Figure 2: Duration Of Survival In Study 4 (Mvasi 02)
A survival curve graph showing the proportion surviving over 48 months of study comparing two treatments: chemotherapy alone (dashed line) and chemotherapy plus bevacizumab (solid line). The x-axis represents study months (0 to 48), and the y-axis shows the proportion surviving (0.0 to 1.0). The number of patients at risk at various time points is listed below the graph for each treatment group.*
FDA Label Image

Figure 3: Duration Of Survival In Study 5 (Mvasi 03)

Figure 3: Duration Of Survival In Study 5 (Mvasi 03)
A survival curve chart comparing the proportion surviving over time (months) for two patient groups: PC (n=444) and PC+Bev (n=434). The chart includes a legend, survival probabilities on the y-axis from 0.0 to 1.0, and duration of survival on the x-axis from 0 to 50 months. A table below the graph shows the number of patients at risk over time intervals for both groups.*
FDA Label Image

Figure 4: Progression Free Survival In Study 8 (Mvasi 04)

Figure 4: Progression Free Survival In Study 8 (Mvasi 04)
A Kaplan-Meier survival curve chart displaying progression-free survival over 24 months. Two curves compare patients receiving Placebo plus IFN-alfa (n=322) and Bevacizumab (Bev) plus IFN-alfa (n=327). The y-axis shows the proportion progression free, and the x-axis shows time in months. Numbers of patients at risk at different time points are indicated below the chart.*
FDA Label Image

Figure 5: Study 9: Overall Survival For Chemotherapy Vs. Chemotherapy Plus Bevacizumab (Mvasi 05)

Figure 5: Study 9: Overall Survival For Chemotherapy Vs. Chemotherapy Plus Bevacizumab (Mvasi 05)
A survival curve chart depicting the proportion of overall survival over months for two groups: chemotherapy alone (n=225) and chemotherapy with bevacizumab (n=227). The x-axis represents overall survival in months, and the y-axis shows the proportion of overall survival. The chart includes a table showing the number of patients at risk over time for each group.*
FDA Label Image

Mvasi 06

Mvasi 06
A Kaplan-Meier plot showing progression-free survival over time in months for three groups labeled CPP, CPB15, and CPB15+. The y-axis represents the proportion of patients progression-free, and the x-axis shows progression-free survival in months, with patient numbers at risk listed below. The plot includes censored values indicated by plus signs for each group.*
FDA Label Image

Principal Display Panelpdp Text And Pdp Image For 100 mg:100 mg/4 mLmvasi™(bevacizumab-awwb)injectionndc 55513-206-01single Dose Vialdiscard Unused Portion100 mg/4 mL (25 mg/ml)contains 1 Single Dose Vialfor Intravenous Infusion After Dilutionstore Refrigerated At 2°c To 8°c (36°f To 46°f).protect From Light. Do Not Freeze Or Shakesterile Solution – No Preservativethis Product Contains Dry Natural Rubber.rx Onlyamgen® (Mvasi 07)

Principal Display Panelpdp Text And Pdp Image For 100 mg:100 mg/4 mLmvasi™(bevacizumab-awwb)injectionndc 55513-206-01single Dose Vialdiscard Unused Portion100 mg/4 mL (25 mg/ml)contains 1 Single Dose Vialfor Intravenous Infusion After Dilutionstore Refrigerated At 2°c To 8°c (36°f To 46°f).protect From Light. Do Not Freeze Or Shakesterile Solution – No Preservativethis Product Contains Dry Natural Rubber.rx Onlyamgen® (Mvasi 07)
A Kaplan-Meier survival curve chart depicting progression-free survival over 24 months. The y-axis shows the proportion progression-free, and the x-axis shows duration in months. Two groups are compared: CT (chemotherapy alone) and CT+Bev (chemotherapy plus bevacizumab), with corresponding survival curves and a table indicating the number of patients at risk over time.*
FDA Label Image

Principal Display Panelpdp Text And Pdp Image For 400 mg:400 mg/16 mLmvasi™(bevacizumab-awwb)injectionndc 55513-207-01single Dose Vialdiscard Unused Portion400 mg/16 mL (25 mg/ml)contains 1 Single Dose Vialfor Intravenous Infusion After Dilutionstore Refrigerated At 2°c To 8°c (36°f To 46°f). Protect From Light. Do Not Freeze Or Shakesterile Solution – No Preservativethis Product Contains Dry Natural Rubber.rx Onlyamgen® (Mvasi 08)

Principal Display Panelpdp Text And Pdp Image For 400 mg:400 mg/16 mLmvasi™(bevacizumab-awwb)injectionndc 55513-207-01single Dose Vialdiscard Unused Portion400 mg/16 mL (25 mg/ml)contains 1 Single Dose Vialfor Intravenous Infusion After Dilutionstore Refrigerated At 2°c To 8°c (36°f To 46°f). Protect From Light. Do Not Freeze Or Shakesterile Solution – No Preservativethis Product Contains Dry Natural Rubber.rx Onlyamgen® (Mvasi 08)
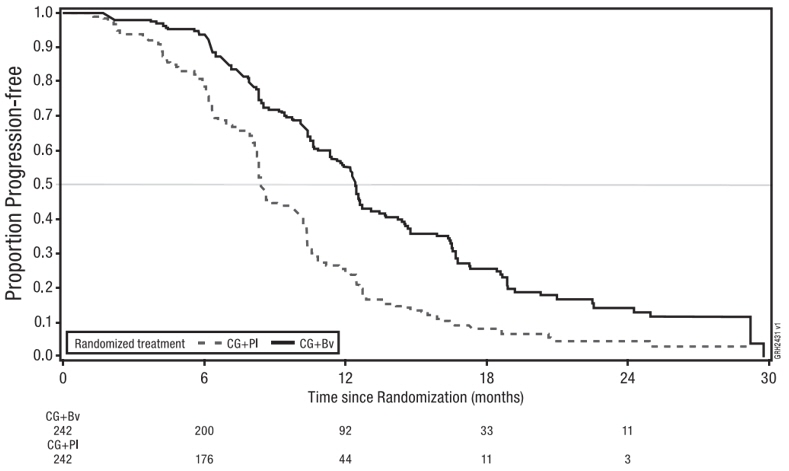
A survival curve chart showing the proportion of patients progression-free over time (months) since randomization, comparing two randomized treatment groups: CG+PI (dashed line) and CG+Bv (solid line). The x-axis represents time in months up to 30, and the y-axis denotes the proportion progression-free from 0 to 1. Numbers at risk at various time points are displayed below the x-axis for both groups.*
FDA Label Image

Mvasi 09

Mvasi 09
A Kaplan-Meier survival curve showing the proportion surviving over study months up to 84 months. Two treatment groups are compared: Crb+Pac (solid line) and Crb+Pac+Bev (dashed line). The graph includes numbers at risk for each group at various time points across the bottom.*
FDA Label Image

Mvasi 10

Mvasi 10
Label for MVASI (bevacizumab-awwb) injection, a human prescription drug by Amgen, Inc. The label indicates a 100 mg/4 mL (25 mg/mL) dosage strength in a single dose vial. It specifies intravenous administration and storage instructions including refrigeration at 2°C to 8°C and protection from light, with no preservatives in the sterile solution.*
FDA Label Image

Mvasi 11

Mvasi 11
MVASI 400 mg/16 mL injection solution vial label by Amgen, Inc. Contains bevacizumab-awwb as the active ingredient for intravenous use. The label specifies storage instructions to keep refrigerated at 2°C to 8°C (36°F to 46°F), protect from light, and not to freeze or shake. It is a single dose vial without preservatives.*

* About these descriptions: Image descriptions on this page are generated by automated AI analysis of the product label images from the manufacturer's FDA label submission (SPL). They are provided for reference only and may contain errors or omissions. Always rely on the printed label itself and the official FDA labeling, and consult a pharmacist or healthcare professional with any questions about this product.