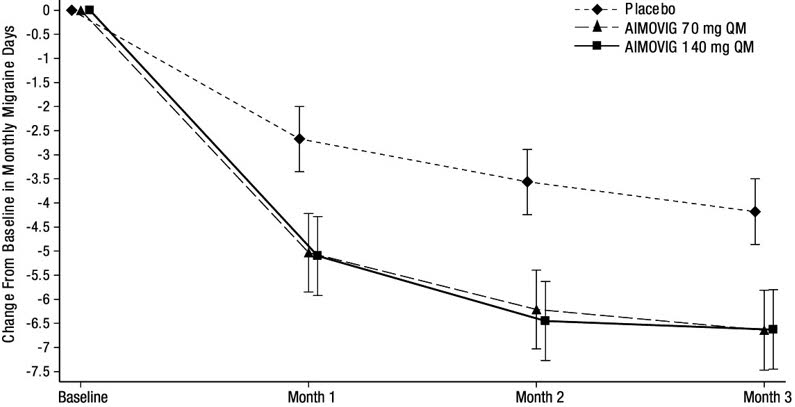
Figure 1: Change From Baseline In Monthly Migraine Days In Study 1a (Aimovig 01)
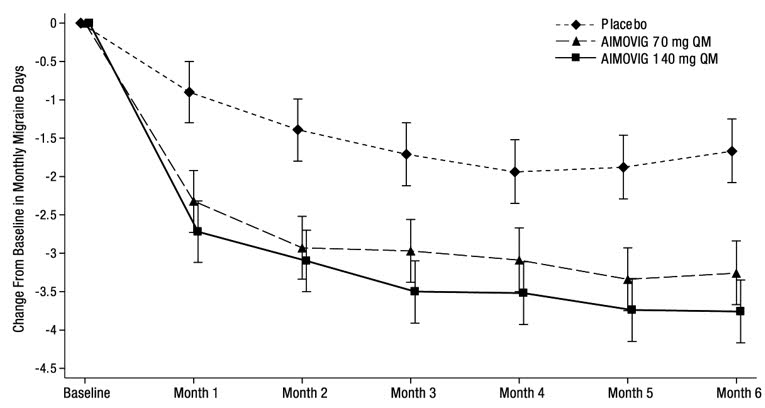
This appears to be a chart or table displaying changes from baseline for a clinical trial involving a placebo and two different doses of a medication called Aimovig (70 mg and 140 mg). The data is organized by month, with columns for baseline and each month up to month 6. There are also two rows labeled "g" and "H" which may be related to the study protocol.*