Product Images Pregabalin

View Photos of Packaging, Labels & Appearance

Product Label Images

The following 14 images provide visual information about the product associated with Pregabalin NDC 55700-904 by Quality Care Products, Llc, such as packaging, labeling, and the appearance of the drug itself. This resource could be helpful for medical professionals, pharmacists, and patients seeking to verify medication information and ensure they have the correct product.

1

1

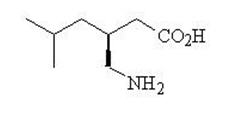
This is a description of a medication containing Pregabalin, being sold in bottles of 60 capsules. The medication is available only with a prescription, and may be habit-forming. The manufacturer is ScieGen Pharmaceuticals based in Hauppauge, NY. The product is packaged and distributed by ZJMW W PMM, with a contact number of 1-800-337-8603. The product has a GTIN of 00355700904609, and NDC of 55700-904-60, with an expiration date of // and should be stored at 77 degrees Fahrenheit. The medication guide included should be reviewed entirely before use.*

Figure 1 - pregabalin fig01

Figure 1 - pregabalin fig01

This is data related to the percentage of patients who have shown improvement, along with the percentage of improvement in pain from their baseline. The accuracy and completeness of this information cannot be ascertained as the text is incomplete and not clear enough.*

Figure 2 - pregabalin fig02

Figure 2 - pregabalin fig02

This appears to be a partial chart or table displaying values for the percentage of patients improved and percent improvement in pain from baseline. A medication called Pregabalin at a dose of 160 mg is mentioned, taken for three days, but it is unclear what medical condition or symptom it is intended for. It is not possible to provide a more specific description due to the limited information provided.*

Figure 3 - pregabalin fig03

Figure 3 - pregabalin fig03

This appears to be a chart or graph displaying various treatments and the percentage of patients who improved while using them. The treatments listed are Pregatalin 300 mg taken three times a day, Pregabain 160 mg taken twice a day, and Pregabalin 75 mg taken two times a day. The chart also includes percentages of improvement in pain from a baseline measurement. There appear to be numerical values displayed, but the formatting is not clear, so it is difficult to fully interpret the data.*

Figure 4 - pregabalin fig04

Figure 4 - pregabalin fig04

Figure 5 - pregabalin fig05

Figure 5 - pregabalin fig05

This appears to be a table showing the results of a clinical trial involving three groups of patients receiving either Fregabalin 100mg taken three times a day, Pregabalin 80mg taken three times a day or a Placebo. The table includes a series of numbers under the heading "Percent of Patients Improved" as well as another set of numbers under the heading "Percent Improvement in Pain from Baseline." The meaning and significance of these numbers cannot be determined without additional context or explanation.*

Figure 6 - pregabalin fig06

Figure 6 - pregabalin fig06

Figure 7 - pregabalin fig07

Figure 7 - pregabalin fig07

Figure 9 - pregabalin fig08

Figure 9 - pregabalin fig08

This document appears to be a chart or graph showing the percent of patients who experienced an improvement in pain based on different doses of pregabalin and a placebo. The chart shows that higher doses of pregabalin (300mg and 450mg daily) resulted in a higher percentage of patients experiencing improvement compared to a placebo. The x-axis shows different levels of improvement in pain from baseline, and the y-axis shows the percentage of patients who experienced that improvement.*

Figure 10 - pregabalin fig09

Figure 10 - pregabalin fig09

This appears to be a chart showing estimated percentages of subjects without LTR (likely an abbreviation for a medical condition or treatment), with the values ranging from 0-100%. The chart also includes the names "Progabain" and "Placebo" and a horizontal axis indicating days, with measurements ranging from 0-180. No further context is provided to fully interpret this chart.*

Figure 11 - pregabalin fig10

Figure 11 - pregabalin fig10

Figure 12 - pregabalin fig11

Figure 12 - pregabalin fig11

The text appears to be a graph showing the percentage of subjects improved after taking either Pregabalin or a Placebo drug over the course of 16 weeks. Improvement percentages are labeled from 100 to 270 and compared for each drug at different dosage levels (210-280 for Pregabalin and 200 for Placebo).*

Cockcroft and Gault equation - pregabalin formula

Cockcroft and Gault equation - pregabalin formula

This text provides a formula to calculate the CLCT, which stands for creatinine clearance, a measure of kidney function. It involves multiplying the result of [140 minus the patient's age in years] with their weight in kilograms. For female patients, this result is multiplied with 0.85. The final step involves multiplying this value with the patient's serum creatinine level in milligrams per deciliter, and then dividing by 72.*

Chemical Structure - pregabalin str

Chemical Structure - pregabalin str

* The product label images have been analyzed using a combination of traditional computing and machine learning techniques. It should be noted that the descriptions provided may not be entirely accurate as they are experimental in nature. Use the information in this page at your own discretion and risk.