Gabapentin Capsule
Product Images NDC 55700-950

View Photos of Packaging, Regulatory Labels, and Product Appearance

Product Visual Gallery

This gallery contains 8 technical images submitted to the FDA as part of the official labeling for Gabapentin (NDC 55700-950). Unlike standard consumer photos, these assets often include clinical data figures, molecular chemical structures, and official manufacturer packaging layouts.

As provided by Quality Care Products, Llc, these visuals offer a comprehensive scientific overview of the product's physical and chemical identity, aiding pharmacists and researchers in product verification and study.

FDA Label Image

Image Description (1)

Image Description (1)
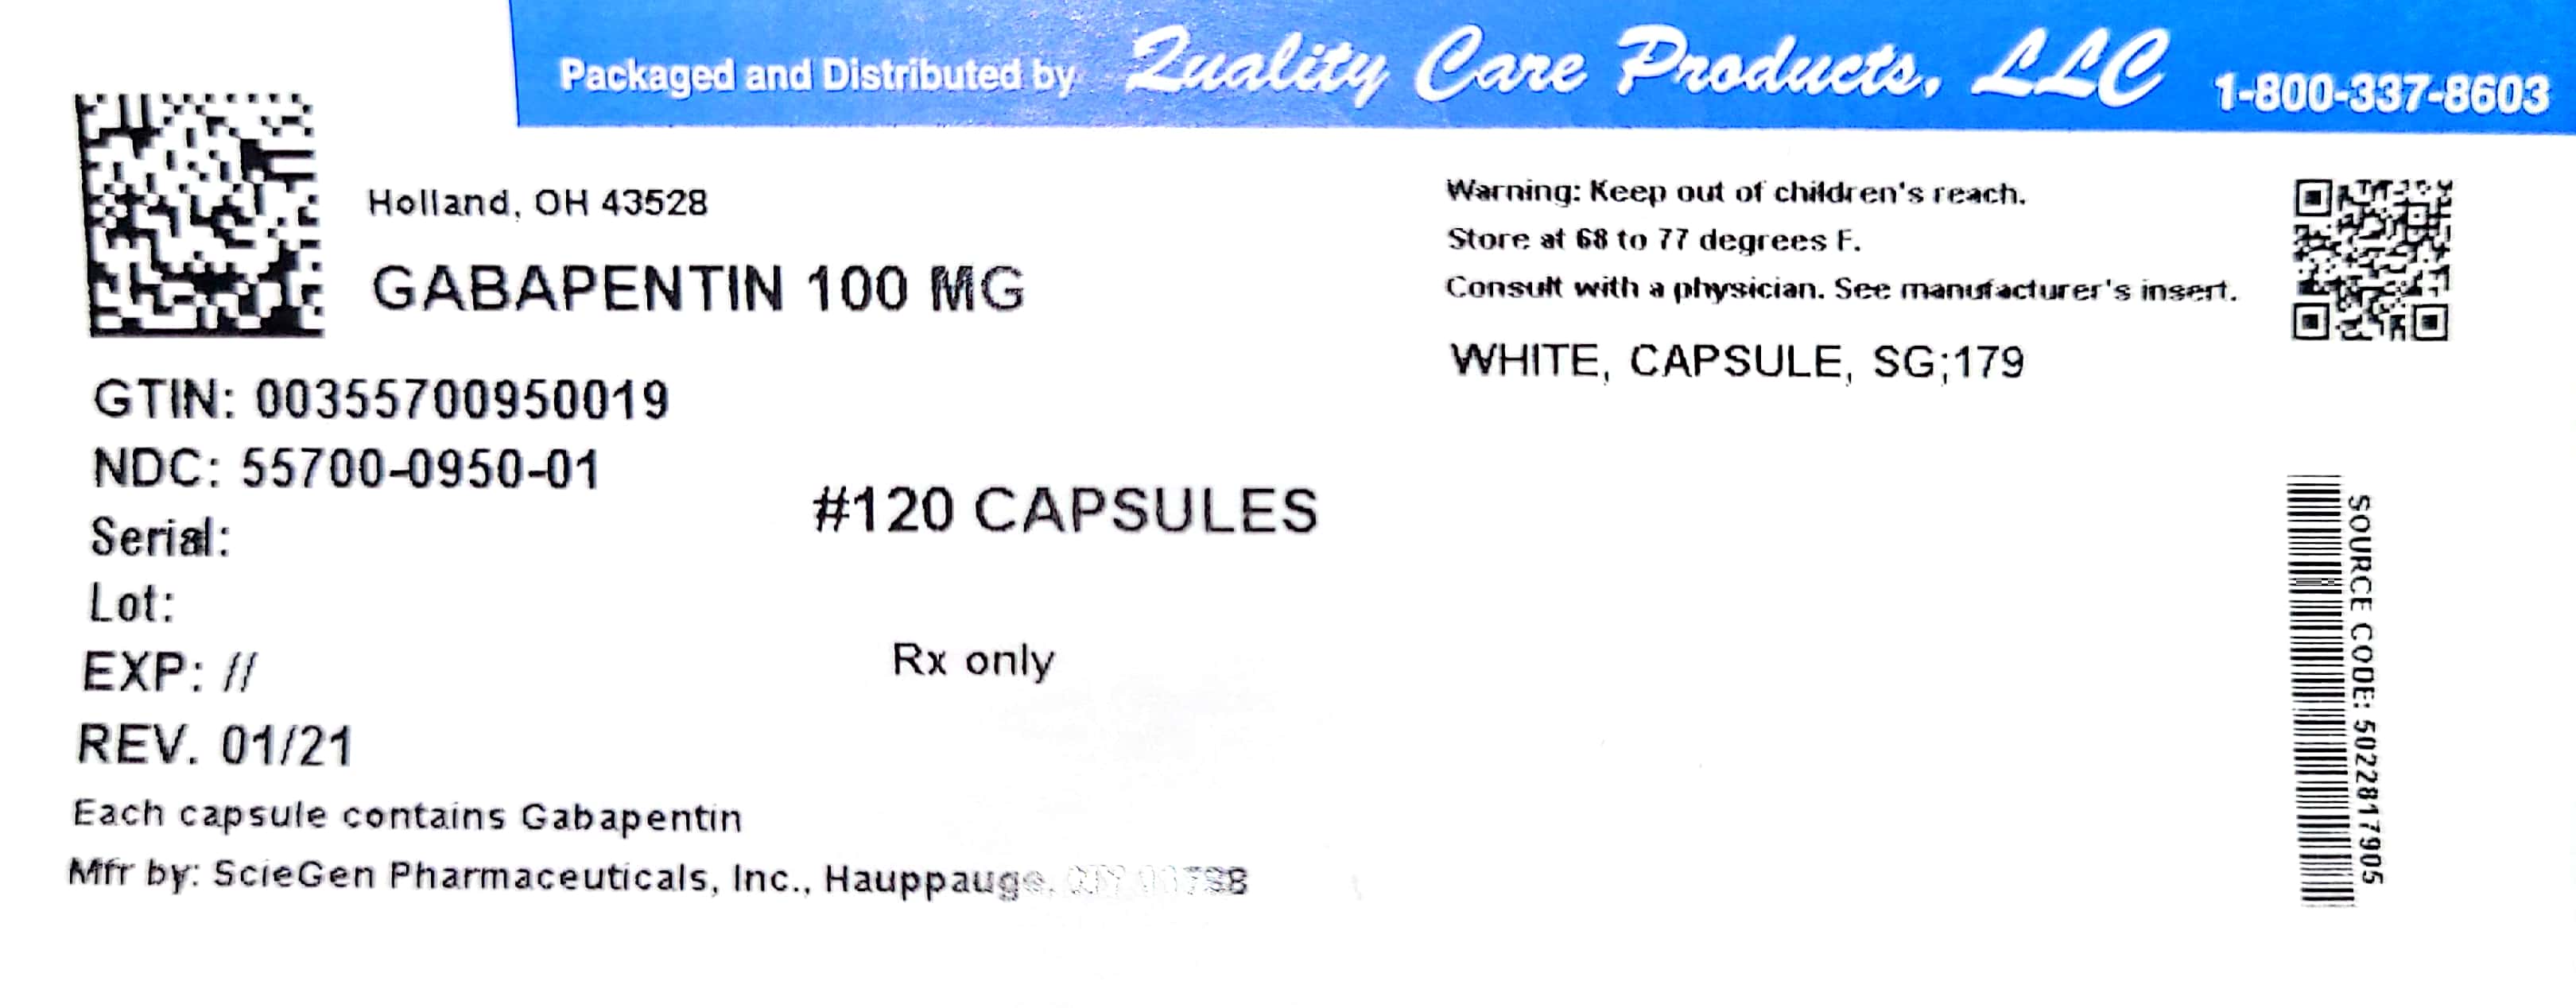
This is a medication for Gabapentin capsules, 100 mg. It is a prescription drug and the manufacturer is ScieGen Pharmaceuticals, Inc. It comes in a white, SG;179 labeled capsule and is sold in bottles of 120 capsules. The GTIN number is 00355700950019, and the NDC number is 55700-0950-01. It needs to be stored at 68 to 77 degrees F and kept out of children's reach. There is more information inside the manufacturer's insert, and it is only available by prescription. The serial, lot, and expiration dates are also listed, but the format is unclear.*
FDA Label Image

Image Description (2)

Image Description (2)
This is a warning label for a medication containing Gabapentin, which comes in a yellow capsule form. The label advises not to keep the medication within children's reach and to store it within a temperature range of 68-77 degrees Fahrenheit. It suggests the consultation of a physician and provides a serial number, lot number, and expiration date. The manufacturer is ScieGen Pharmaceuticals, Inc. This label also includes a GTIN and NDC number.*
FDA Label Image

Figure 1 (Image 01)

FDA Label Image

Figure 2 (Image 02)

Figure 2 (Image 02)
This appears to be a graph showing the results of a 4-week fixed dose period study on the effects of a placebo and two dosages of gabapentin on pain scores. The X-axis represents the weeks of the study, while the Y-axis represents the mean pain score. There were three treatment groups: placebo, 1800mg/day of gabapentin, and 2400mg/day of gabapentin. The graph shows that by week 3, both gabapentin dosages resulted in a lower mean pain score compared to the placebo group.*
FDA Label Image

Figure 3 (Image 03)

FDA Label Image

Cockcroft And Gault Equation (Image 04)

FDA Label Image

Gabapentin Structural Formula (Image 05)

FDA Label Image

Image-09 (Image 09)

* These product label images have been analyzed using experimental machine learning. Please verify findings with the primary label text.