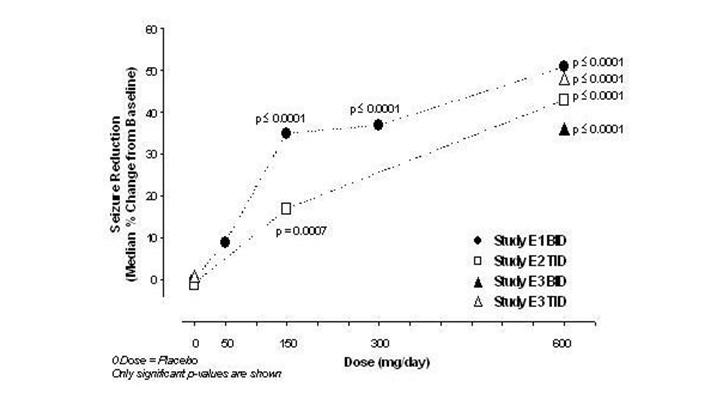
Image Description (1)

This is a warning label for Pregabalin capsules manufactured by ScieGen Pharmaceuticals. The label provides information on dosage, ingredients, and potential side effects. It also warns that the medication may be habit-forming and should be kept out of the reach of children. The manufacturing company's address is also provided.*