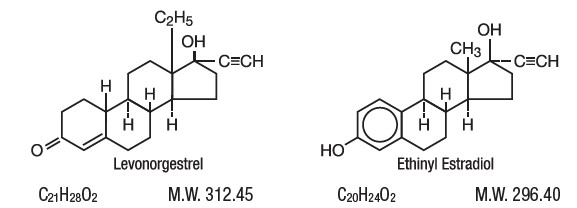
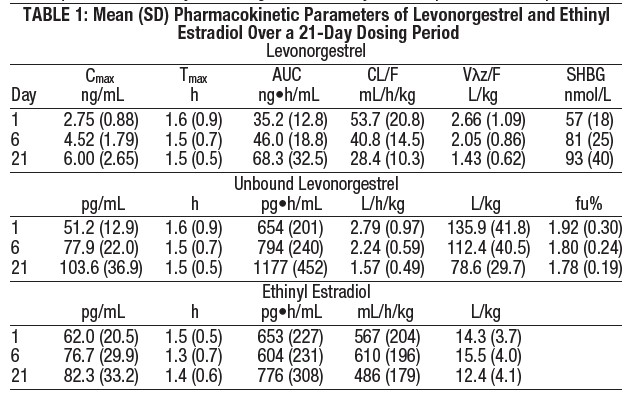
Figure1 (Figure1)
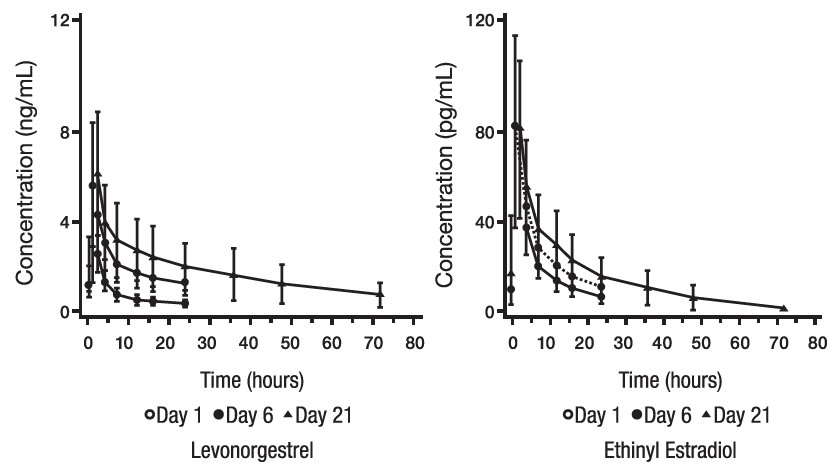
This information appears to be a chart showing the concentration of Levonorgestrel and Ethinyl Estradiol over a period of time (from day 1 to day 21) in hours. The concentration of Levonorgestrel is measured in ng/mL, while the concentration of Ethinyl Estradiol is measured in pg/mL. The chart displays the time points and concentrations of the two substances, with values at different time intervals.*