Figure 1 Symptom Score In A Long-term Efficacy And Safety Study (Finasteride Fig1)
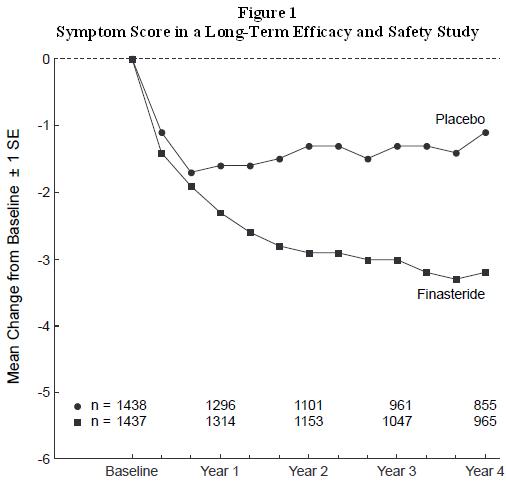
This appears to be a table or figure displaying the mean change from baseline and standard error in symptom score for a long term efficacy and safety study involving a placebo and finasteride treatment. The table shows data for the baseline, year 1, year 2, year 3, and year 4 time points. No other information can be inferred from the given text.*