Figure 1. Mean Change From Baseline For Hba1c In A 26-week Placebo-controlled Dose-ranging Study (observed Values) (Pioglitazone Fig1)
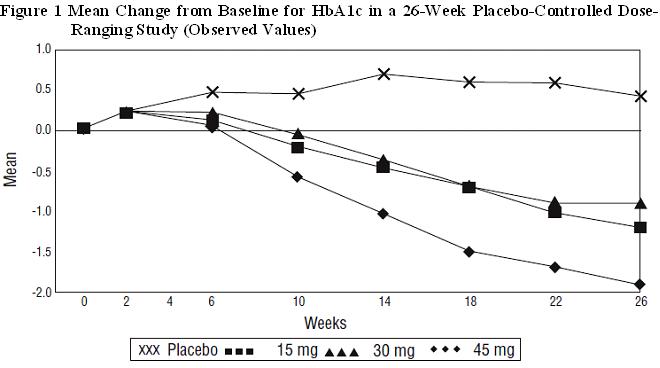
The text describes the mean change in HbAlc levels in a 26-week, placebo-controlled dose-ranging study. The data is presented graphically in Figure 1, which shows the observed values for three different doses (15mg, 30mg, and 45mg) plotted over time. The x-axis represents the number of weeks in the study, while the y-axis represents the mean change in HbAlc levels from baseline.*